
Nasdaq 100 and S&P500: Tech Stocks Slide as AI Spending Hits US Stocks Today
Tech stocks drag the S&P 500 and Nasdaq 100 lower as AI spending fears, weak forecasts, and alarming layoff data weigh on US stock market sentiment.
Risk-Off Sentiment Dominates Thursday Open
Risk-aversion remained the theme in the financial markets ahead of the U.S. stock market opening on Thursday with all three major indexes lower along with speculator favorites bitcoin and silver.
At 14:44 GMT, E-mini Dow Futures are trading 49347.00, down 242.00 or -0.49%. E-mini S&P 500 Index Futures are at 6843.50, down 62.75 or -0.91% and E-mini Nasdaq-100 Index Futures are trading 24733.75, down 265.50 or -1.06%.
Alphabet’s AI Spending Spooks Tech Investors
The benchmark S&P 500 Index is down for a third session as this week’s turbulent trading sessions continue, not only led by a sell-off in chip and software stocks, but also by one of the so-called “Magnificent Seven” companies, Alphabet. The tech giant is down 4% in premarket trading after announcing a major increase in artificial intelligence spending that frightened investors enough to bail out of the stock.
Qualcomm Crashes on Memory Shortage Forecast
Before the opening, Qualcomm is also taking a hit, dropping 11% in the pre-market after posting a disappointing forecast due to a global memory shortage.
Other notable stocks taking an early hit are Estee Lauder, Carrier Global and Arm Holdings. Bucking the early trend are Align Technology, Corpay and Cardinal Health.
Layoff Data Hits Highest Since Financial Crisis
Disappointing labor market data also weighed on sentiment after outplacement firm Challenger, Gray & Christmas reported that U.S. employers announced 108,435 layoffs in January, the biggest total since the global financial crisis. Additionally, weekly initial claims for the week ended January 31 rose more than expected, according to the U.S. Labor Department.
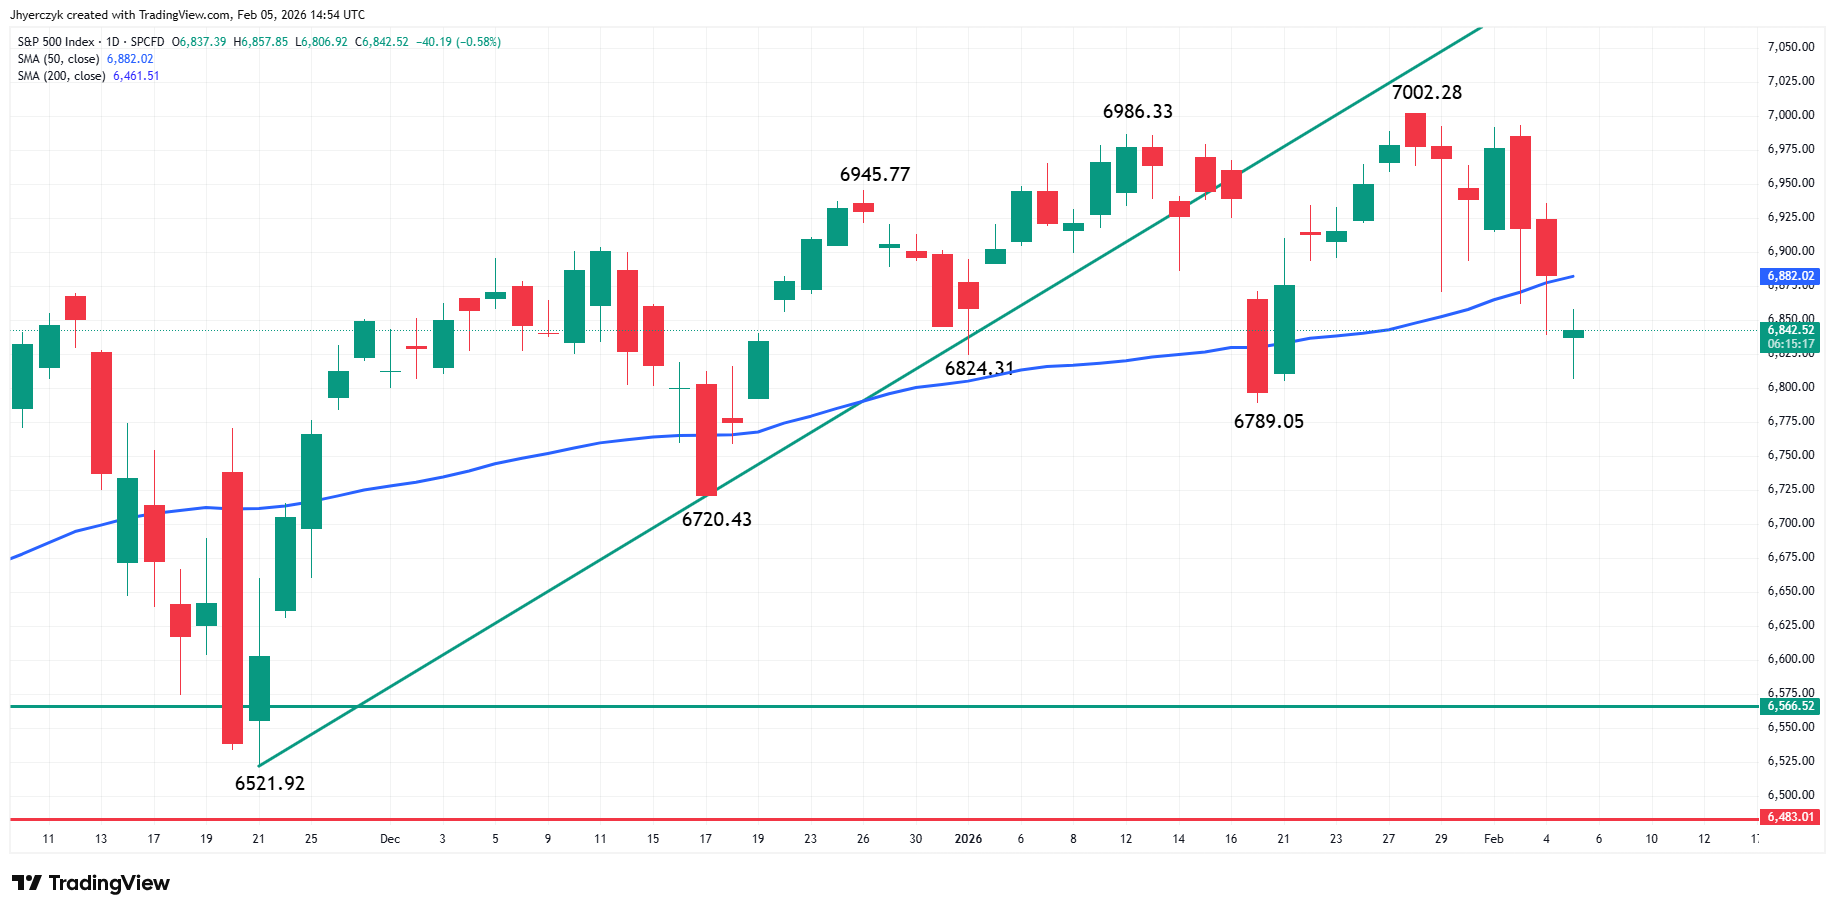
S&P 500 Breaks Below 50-Day MA, Turns Bearish
The March E-mini S&P 500 Index flipped to bearish on Wednesday when it closed under the 50-day moving average at 6929.77, making it new resistance. The index also turned lower for the year when it dropped under 6892.50. The downside momentum created by those moves puts the January 21 bottom at 6814.50 and a 50% level at 6813.00 on the radar.
Key Support Cluster at 6813-6814.50 in Focus
Although we could see a technical bounce on the initial test of 6813.00, a clean break of this level could trigger an acceleration into December 18 bottom at 6771.50, which is also a potential trigger point for an even greater decline with some chart patterns pointing at 6583.00 over the near-term.
Looking at the chart over the past two months shows the upper end is a little crowded and the way of least resistance pointed lower.
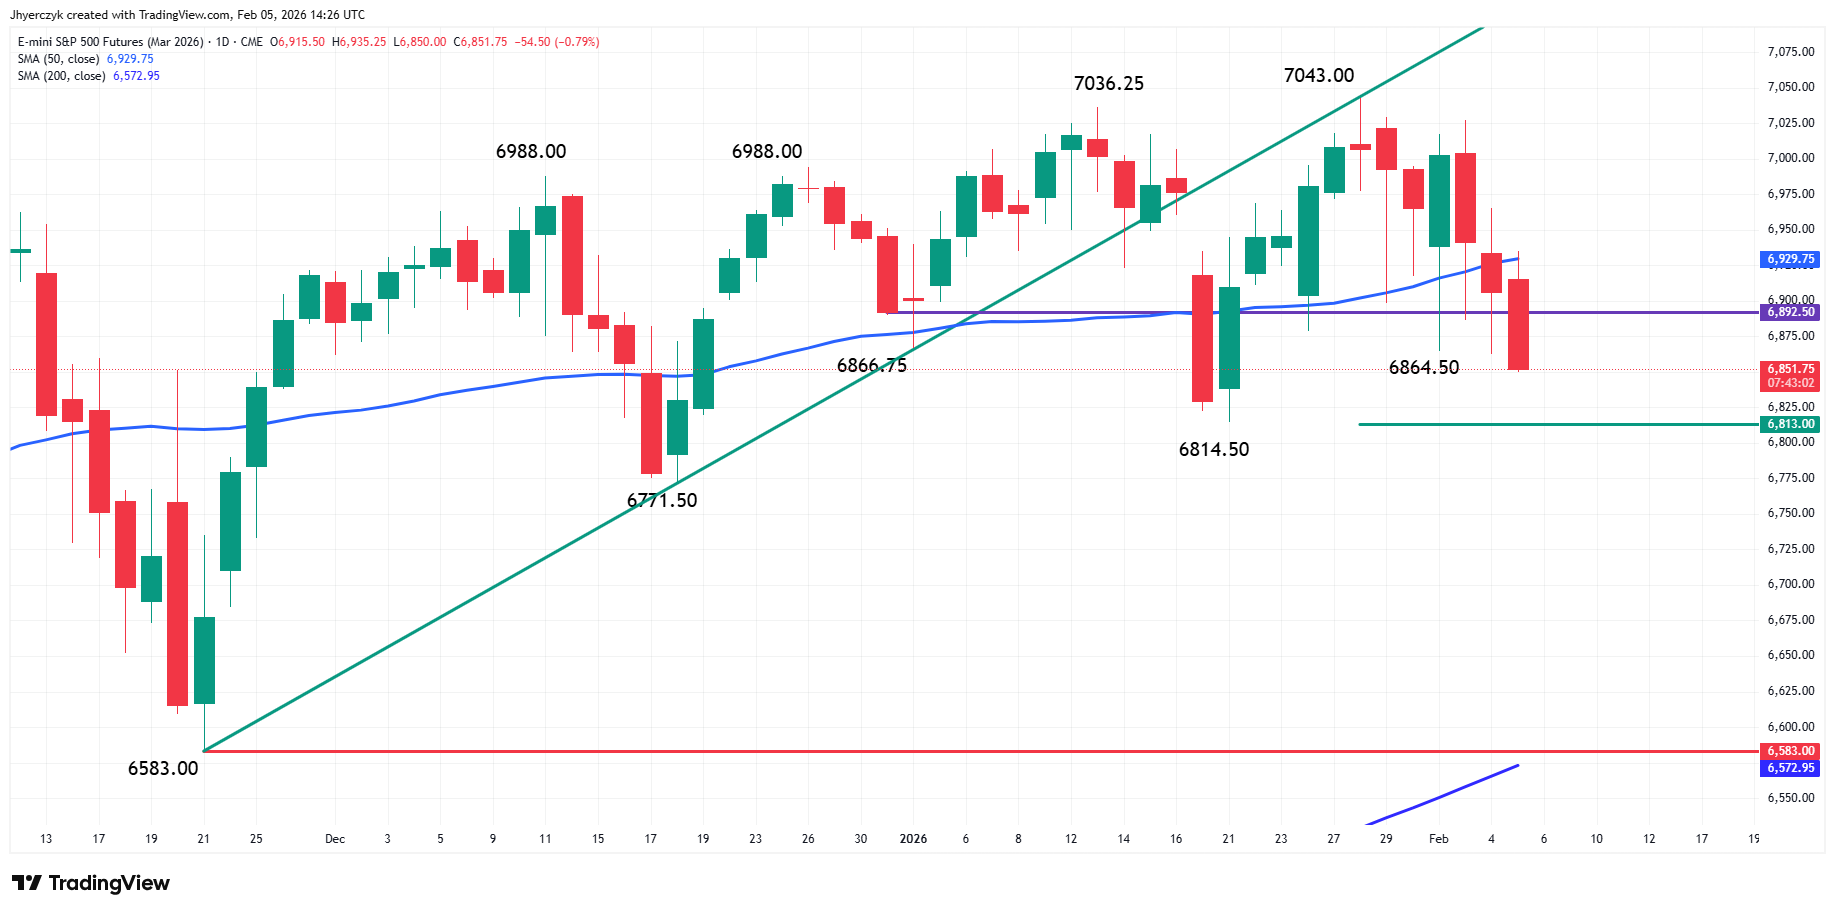
Nasdaq-100 Shows Relative Weakness Among Majors
Technical analysis of the March E-mini Nasdaq-100 Index futures contract reveals that this market is the weakest of the majors. The tech-weighted index has been selling off hard since Tuesday after failing at the 50-day moving average at 25759.36.
Bears Target 200-Day MA After Multiple Breakdowns
The downside momentum created by this move along with a breakdown under a key 50% level at 25411.75 and a long-term downtrend line at 25385.25 have set in motion a wave of new selling that has the bears targeting the 200-day moving average at 24174.00 and the November 21 main bottom at 24153.50.
Oversold Bounce Possible if Targets Hit Intraday
The fundamentals aren’t likely to change in one session, but oversold conditions could trigger a late session reversal if the major downside targets are reached intraday.
More Information in our Economic Calendar.