
Advertisement
Advertisement
30-Yr U.S. Treasury Bonds (US) Futures Technical Analysis – August 11, 2015 Forecast
By:
September 30-Year U.S. Treasury Bonds posted an inside day, lower close on Monday, following Friday’s strong rally. There was no follow-through to the
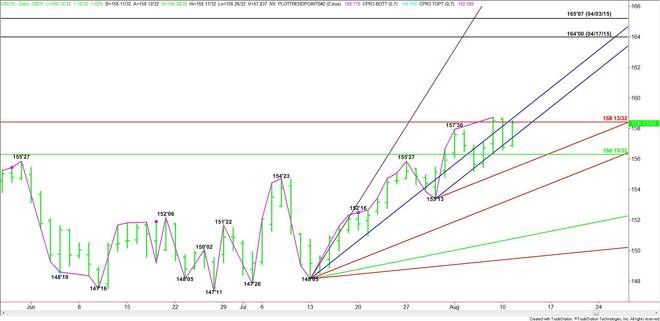
September 30-Year U.S. Treasury Bonds posted an inside day, lower close on Monday, following Friday’s strong rally. There was no follow-through to the downside, however, during the pre-market session. The market remains inside Friday’s main range which suggests impending volatility, however, unlike yesterday’s close, there is now a slight upside bias.
Earlier today, T-Bonds found support on a steep uptrending angle at 157’13. The next target under this angle is a major 50% level at 156’10. The daily chart opens up to the downside with the next target an uptrending angle at 155’13.
On the upside, the first key target is a major Fibonacci level at 158’13. This is followed by a steep uptrending angle at 158’21. Crossing to the strong side of this angle will put T-Bonds in an extremely strong position.
The daily chart is wide open to the upside with the April 17 top at 164’00 and the April 3 top at 165’07 the major upside targets. These targets are not likely to be reached unless a 2016 Fed rate hike is taken completely off the table.
About the Author
James Hyerczykauthor
James Hyerczyk is a U.S. based seasoned technical analyst and educator with over 40 years of experience in market analysis and trading, specializing in chart patterns and price movement. He is the author of two books on technical analysis and has a background in both futures and stock markets.


Advertisement