
Advertisement
Advertisement
30-Yr U.S. Treasury Bonds (US) Futures Technical Analysis – August 26, 2015 Forecast
By:
September 30-Year U.S. Treasury Bonds are trading slightly better shortly before the cash market opening. The main trend is up according to the daily
September 30-Year U.S. Treasury Bonds are trading slightly better shortly before the cash market opening. The main trend is up according to the daily swing chart, however, yesterday’s sell-off has shifted the momentum to the downside.
The chart pattern suggests that this market is very vulnerable to the downside. Holding T-Bonds may even be riskier than holding stocks at this point. Nonetheless, T-Bond traders will likely be watching the volatility and direction of the stock indices today for guidance. Another steep sell-off in the equities markets is likely to trigger a resumption of the flight-to-safety rally. A rebound rally by stocks, however, could trigger a steep drop in T-Bonds.
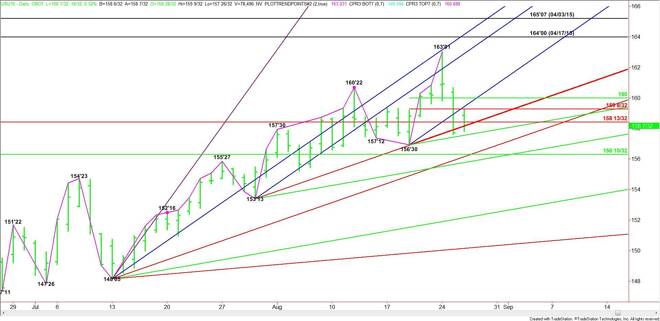
Currently, T-Bonds are straddling a major Fibonacci level at 158’13 and a pair of uptrending angles at 158’06 and 158’05. Trader reaction to this area is likely to determine the direction of the market today.
A sustained rally over 158’13 could drive the market into a series of potential resistance points at 159’08, 159’14 and 160’00. The rally will be labored until 160’00 is taken out with strong buying. This would put the market in a position to accelerate to the upside with 163’00 a potential target.
A sustained move under 158’05 will indicate that the selling is getting stronger. The first minor support target is 157’18. This is followed by the main bottom at 156’30.
A trade through 156’30 will turn the main trend to down. This could trigger a further break into 156’10, 156’05 and 155’25.
T-Bonds are vulnerable to a wash-out to the downside if support fails at 155’25. The next major downside target under this price is the main bottom at 153’13.
Early today, watch the price action at 158’13 and 158’05. Trader reaction to this area will tell us whether the bulls or the bears have the upper hand. Look for a bullish tone to develop on a sustained move over 158’13 and a bearish tone to develop on a sustained move under 158’05.
About the Author
James Hyerczykauthor
James Hyerczyk is a U.S. based seasoned technical analyst and educator with over 40 years of experience in market analysis and trading, specializing in chart patterns and price movement. He is the author of two books on technical analysis and has a background in both futures and stock markets.


Advertisement