
AUD/USD is laughing in the face of domestic misery today. We just watched the Westpac–Melbourne Institute Consumer Sentiment Index fall off a cliff, plunging 12.5% to a reading of 80.1. Yes, that’s a brutal number. But the safe-haven US Dollar is actually the one bleeding out. Traders are chasing rumors of a Middle East diplomatic breakthrough, even as the US Navy blockades Iranian ports. It’s a seven-day losing streak for the greenback. AUD/USD is the primary beneficiary of this rotation.


Bar chart showing the 12.5% plunge in Australian Westpac Consumer Sentiment for April 2026. Source:TradingView
RBA Tightening Expectations Anchor the Aussie
Why isn’t the AUD/USD crashing on such bad sentiment? Simple. The RBA is trapped. With average pump prices hitting $2.40/litre and inflation expectations rising, the RBA can’t afford to be dovish. I noticed that the ASX 30 Day Interbank Cash Rate Futures are now pricing in a 64% chance of a hike to 4.35% in May. Higher yields equal a stronger currency. Domestic consumers are suffering, but the global stagflation trade is keeping the Aussie supported as a commodity-linked proxy.
Weekly Supertrend Flips to Bullish Territory
The medium to long-term chart has finally cleared its throat. After a couple weeks of compression, we’ve seen price action punch through the weekly Short Supertrend ceiling. We’re reclaiming the previous high from early March. This doesn’t seem to be just a relief rally. The trend has shifted back to positive with a firm floor at 0.6725.
AUD/USD Price Forecast
Every new AUD/USD analysis as it publishes, today's technical signal and key levels, live price — on one page.
See all AUD/USD forecasts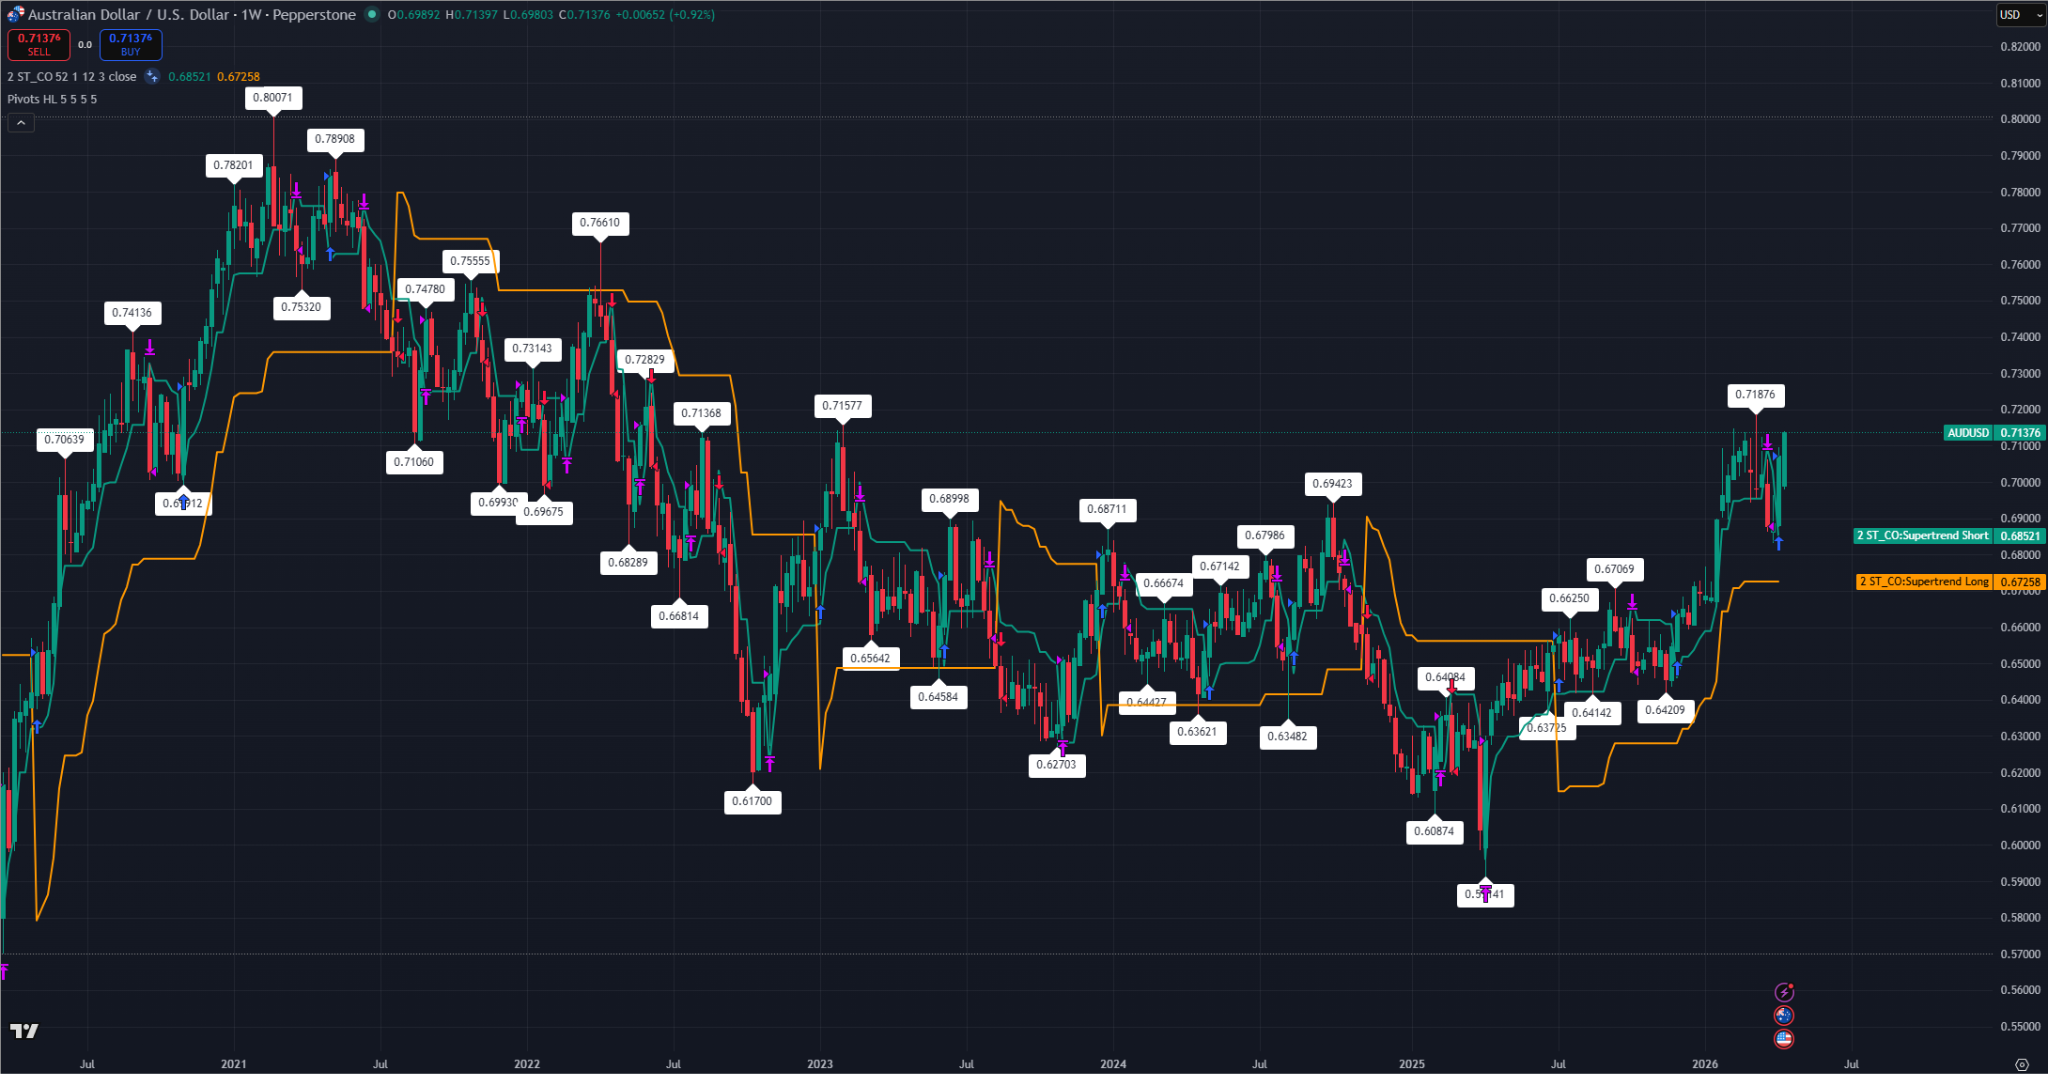
Weekly candlestick chart of AUD/USD showing a breakout above the Supertrend indicator. Source:TradingView
Daily Momentum Accelerates Above the 21-EMA
On the daily timeframe, the V-shaped recovery I was watching has matured. We cleared the 21-day EMA with authority. I like that the RSI is pushing toward past 60, which means we have more room to run before hitting overbought and a potential cross under 70 exhaustion. The 0.71875 cycle high is the immediate target. If we close the week above 0.7140, the path to 0.7300 is wide open.
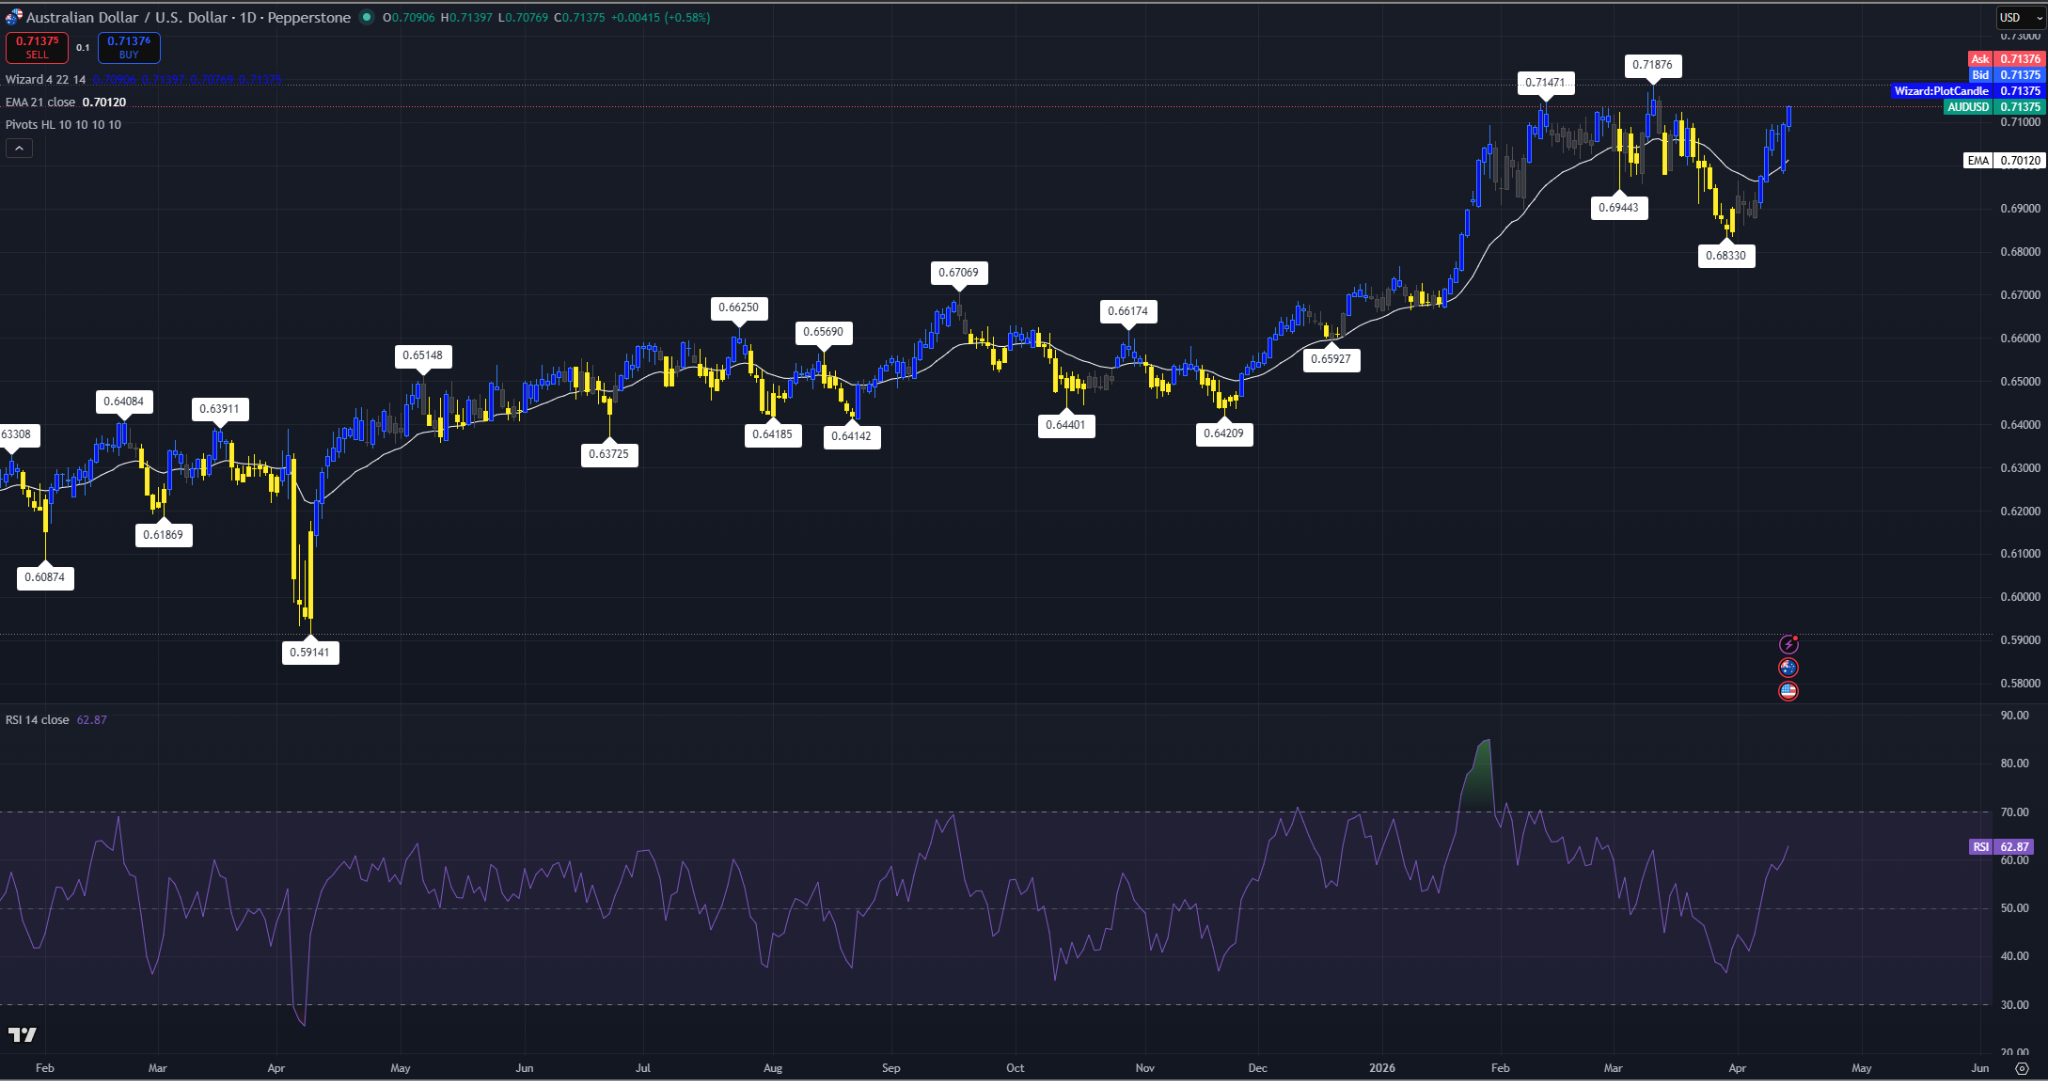
Daily AUD/USD chart showing price trading above the 21-EMA and rising RSI. Source:TradingView
Renko Structure Confirms Intraday Strength
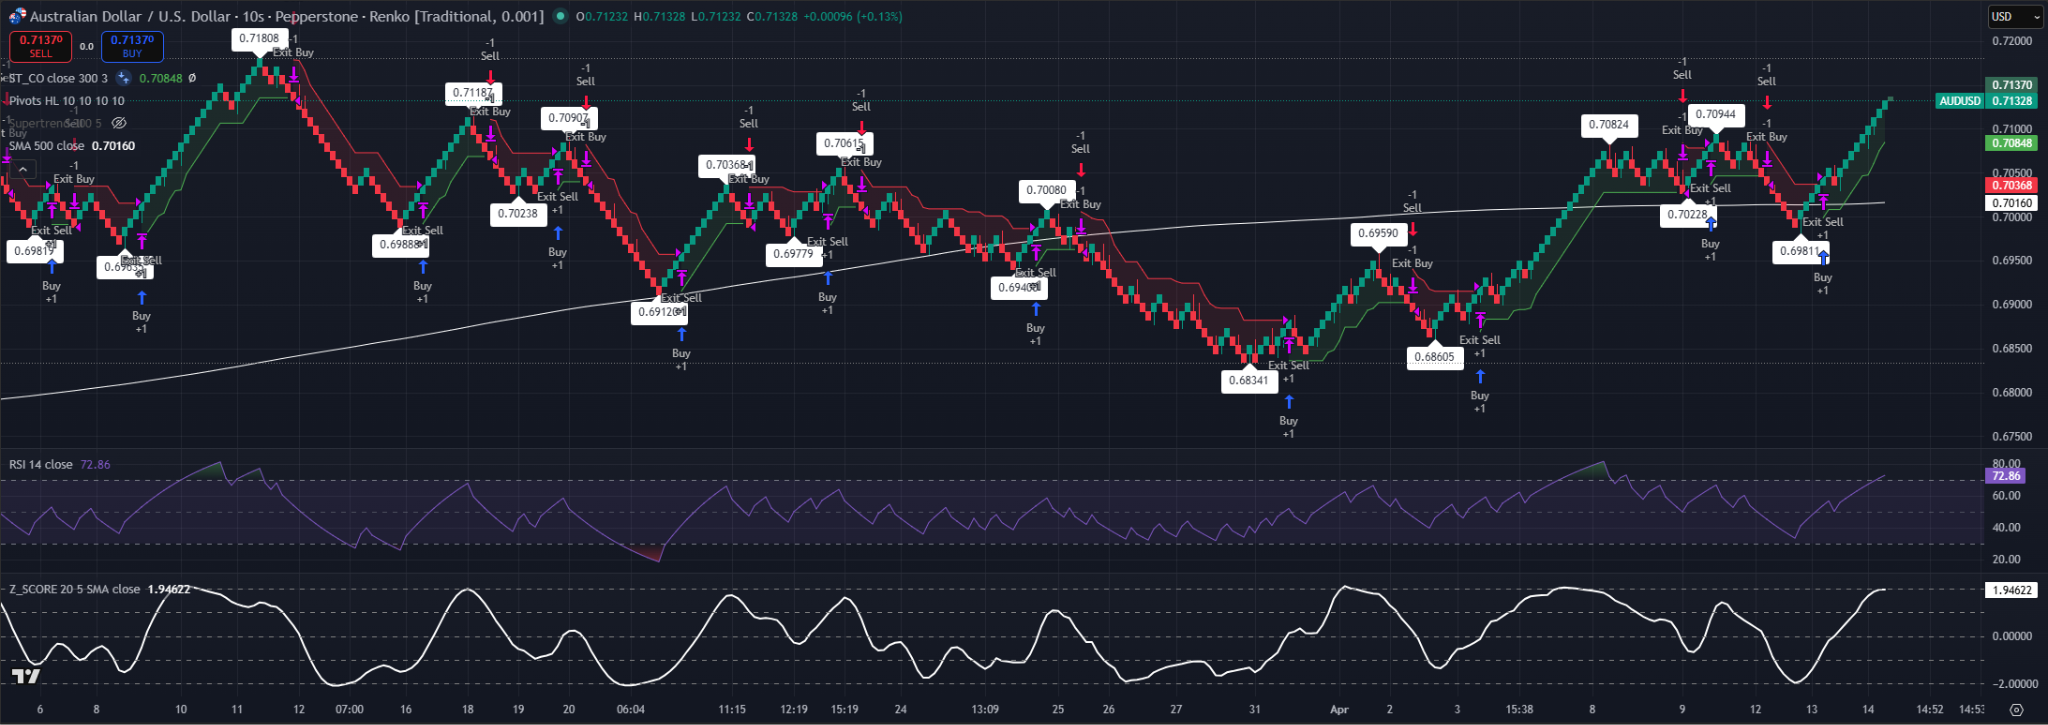
Looking at the 0.001-Brick Renko, the trend is up and to the right. We’ve seen a steady stream of green bricks since the 0.703 floor was established. The Supertrend is green, and the price is comfortably above the 500 SMA. I noticed the Z-Score is stretching above 1.94. It’s getting a bit hot. We might see a minor “cooling off” period or a back-test of 0.7084 before the next leg higher. But for now, the path of least resistance is up.
Micro-Structure Remains Bullish as Buyers Ignore Sentiment Data
Key Resistance Levels: 0.71875
Medium Term Path: I expect AUD/USD to continue its ascent toward the 0.71875 cycle high. Despite the negative consumer sentiment print, the combination of a weakening USD and a hawkish RBA is creating a powerful tailwind. Rallies may stall briefly near the 0.7150 psychological level, but the technical structure remains firmly in the hands of the bulls. Watch for a re-test of 0.7300 by early May.