Bitcoin (BTC) is nearing a bearish weekly moving-average crossover that previously appeared before an additional 30% price decline.

BTC May Dump Below $45,000 If History Repeats
Bitcoin’s 20-week exponential moving average (20-week EMA, green) is approaching a crossover below its 200-week EMA (blue), forming a rare “death cross” on the weekly chart.
The 20-week EMA tracks Bitcoin’s shorter-term trend, while the 200-week EMA reflects its long-term market cycle. A crossover below it would show that recent selling pressure is beginning to undermine Bitcoin’s broader trend.
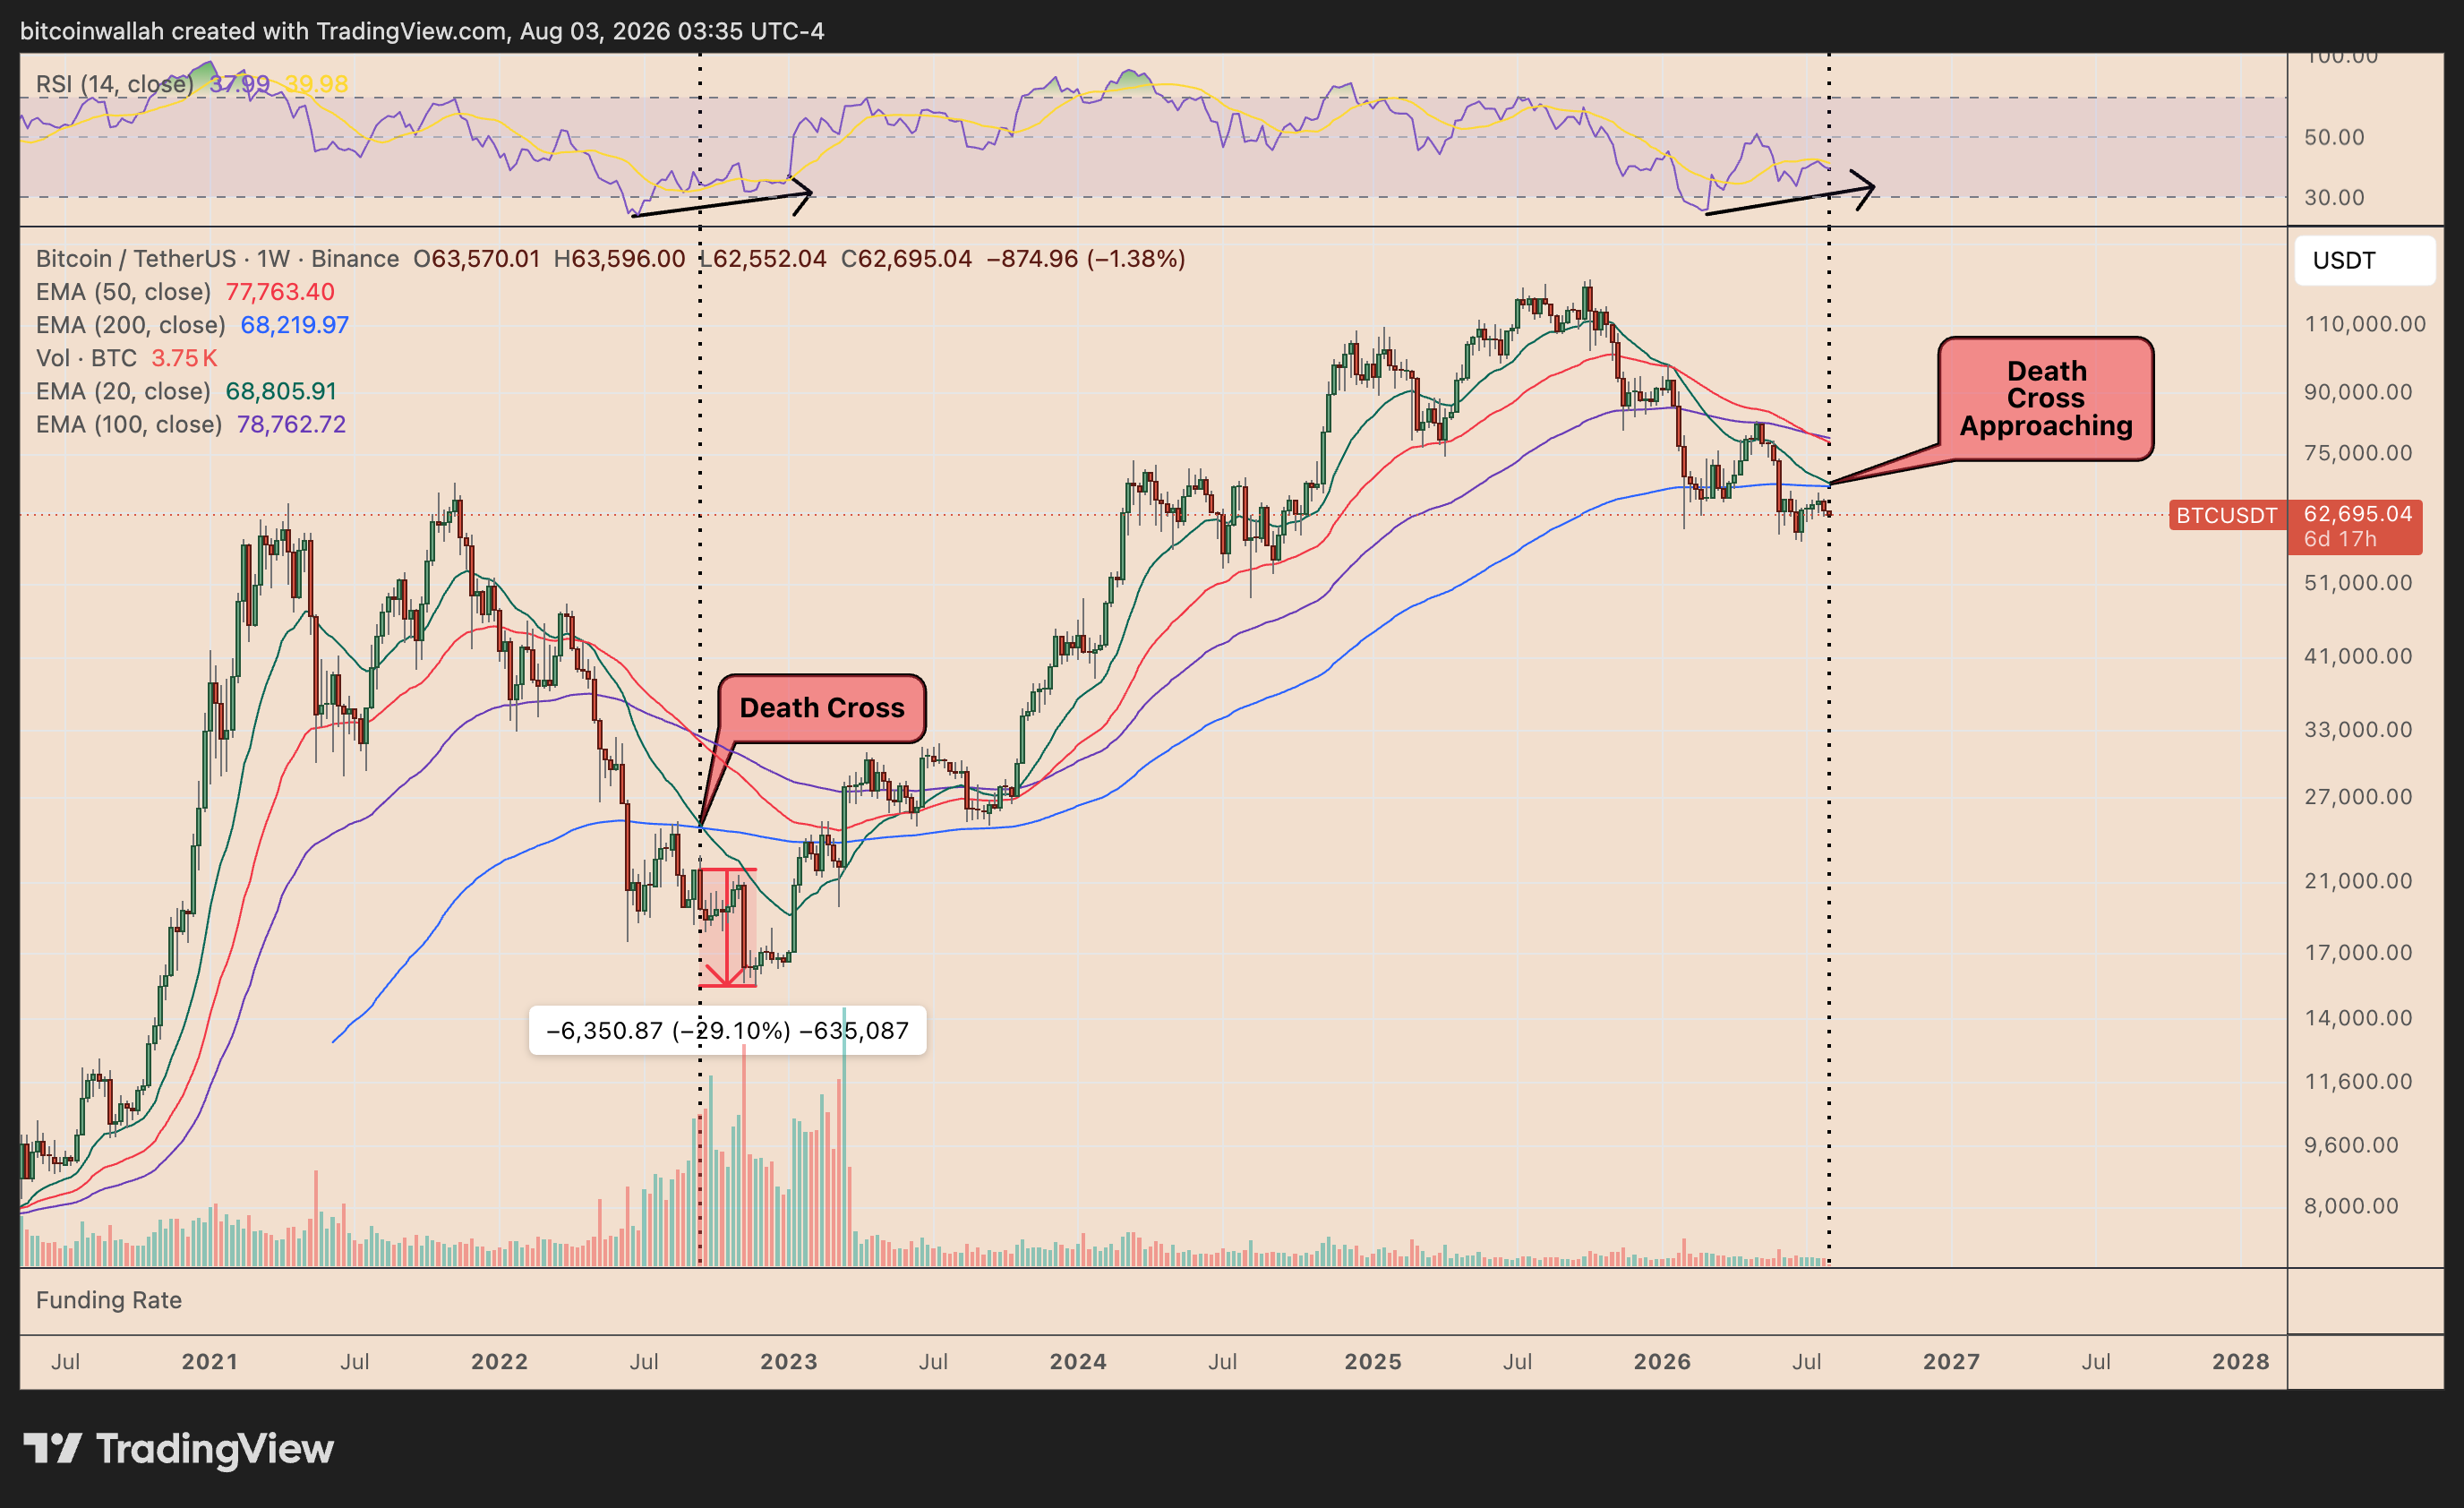
A similar crossover appeared in late 2022 after Bitcoin’s prolonged bear-market decline. The cryptocurrency subsequently dropped by approximately 29% before establishing a cycle bottom near $15,500.
BTC may decline under $45,000 if history repeats.
Bitcoin Price Forecast
Every new Bitcoin analysis as it publishes, today's technical signal and key levels, live price — on one page.
See all Bitcoin forecastsInverse Cup-and-Handle Also Targets Bitcoin Below $45,000
Bitcoin appears to be forming an inverse cup-and-handle, a bearish reversal pattern characterized by a rounded top followed by a smaller upward-sloping consolidation.
The rounded portion developed as BTC rallied from roughly $59,000 toward $82,000 before retreating to the $58,000–$60,000 region. Its subsequent rebound inside a narrow rising channel represents the potential handle.
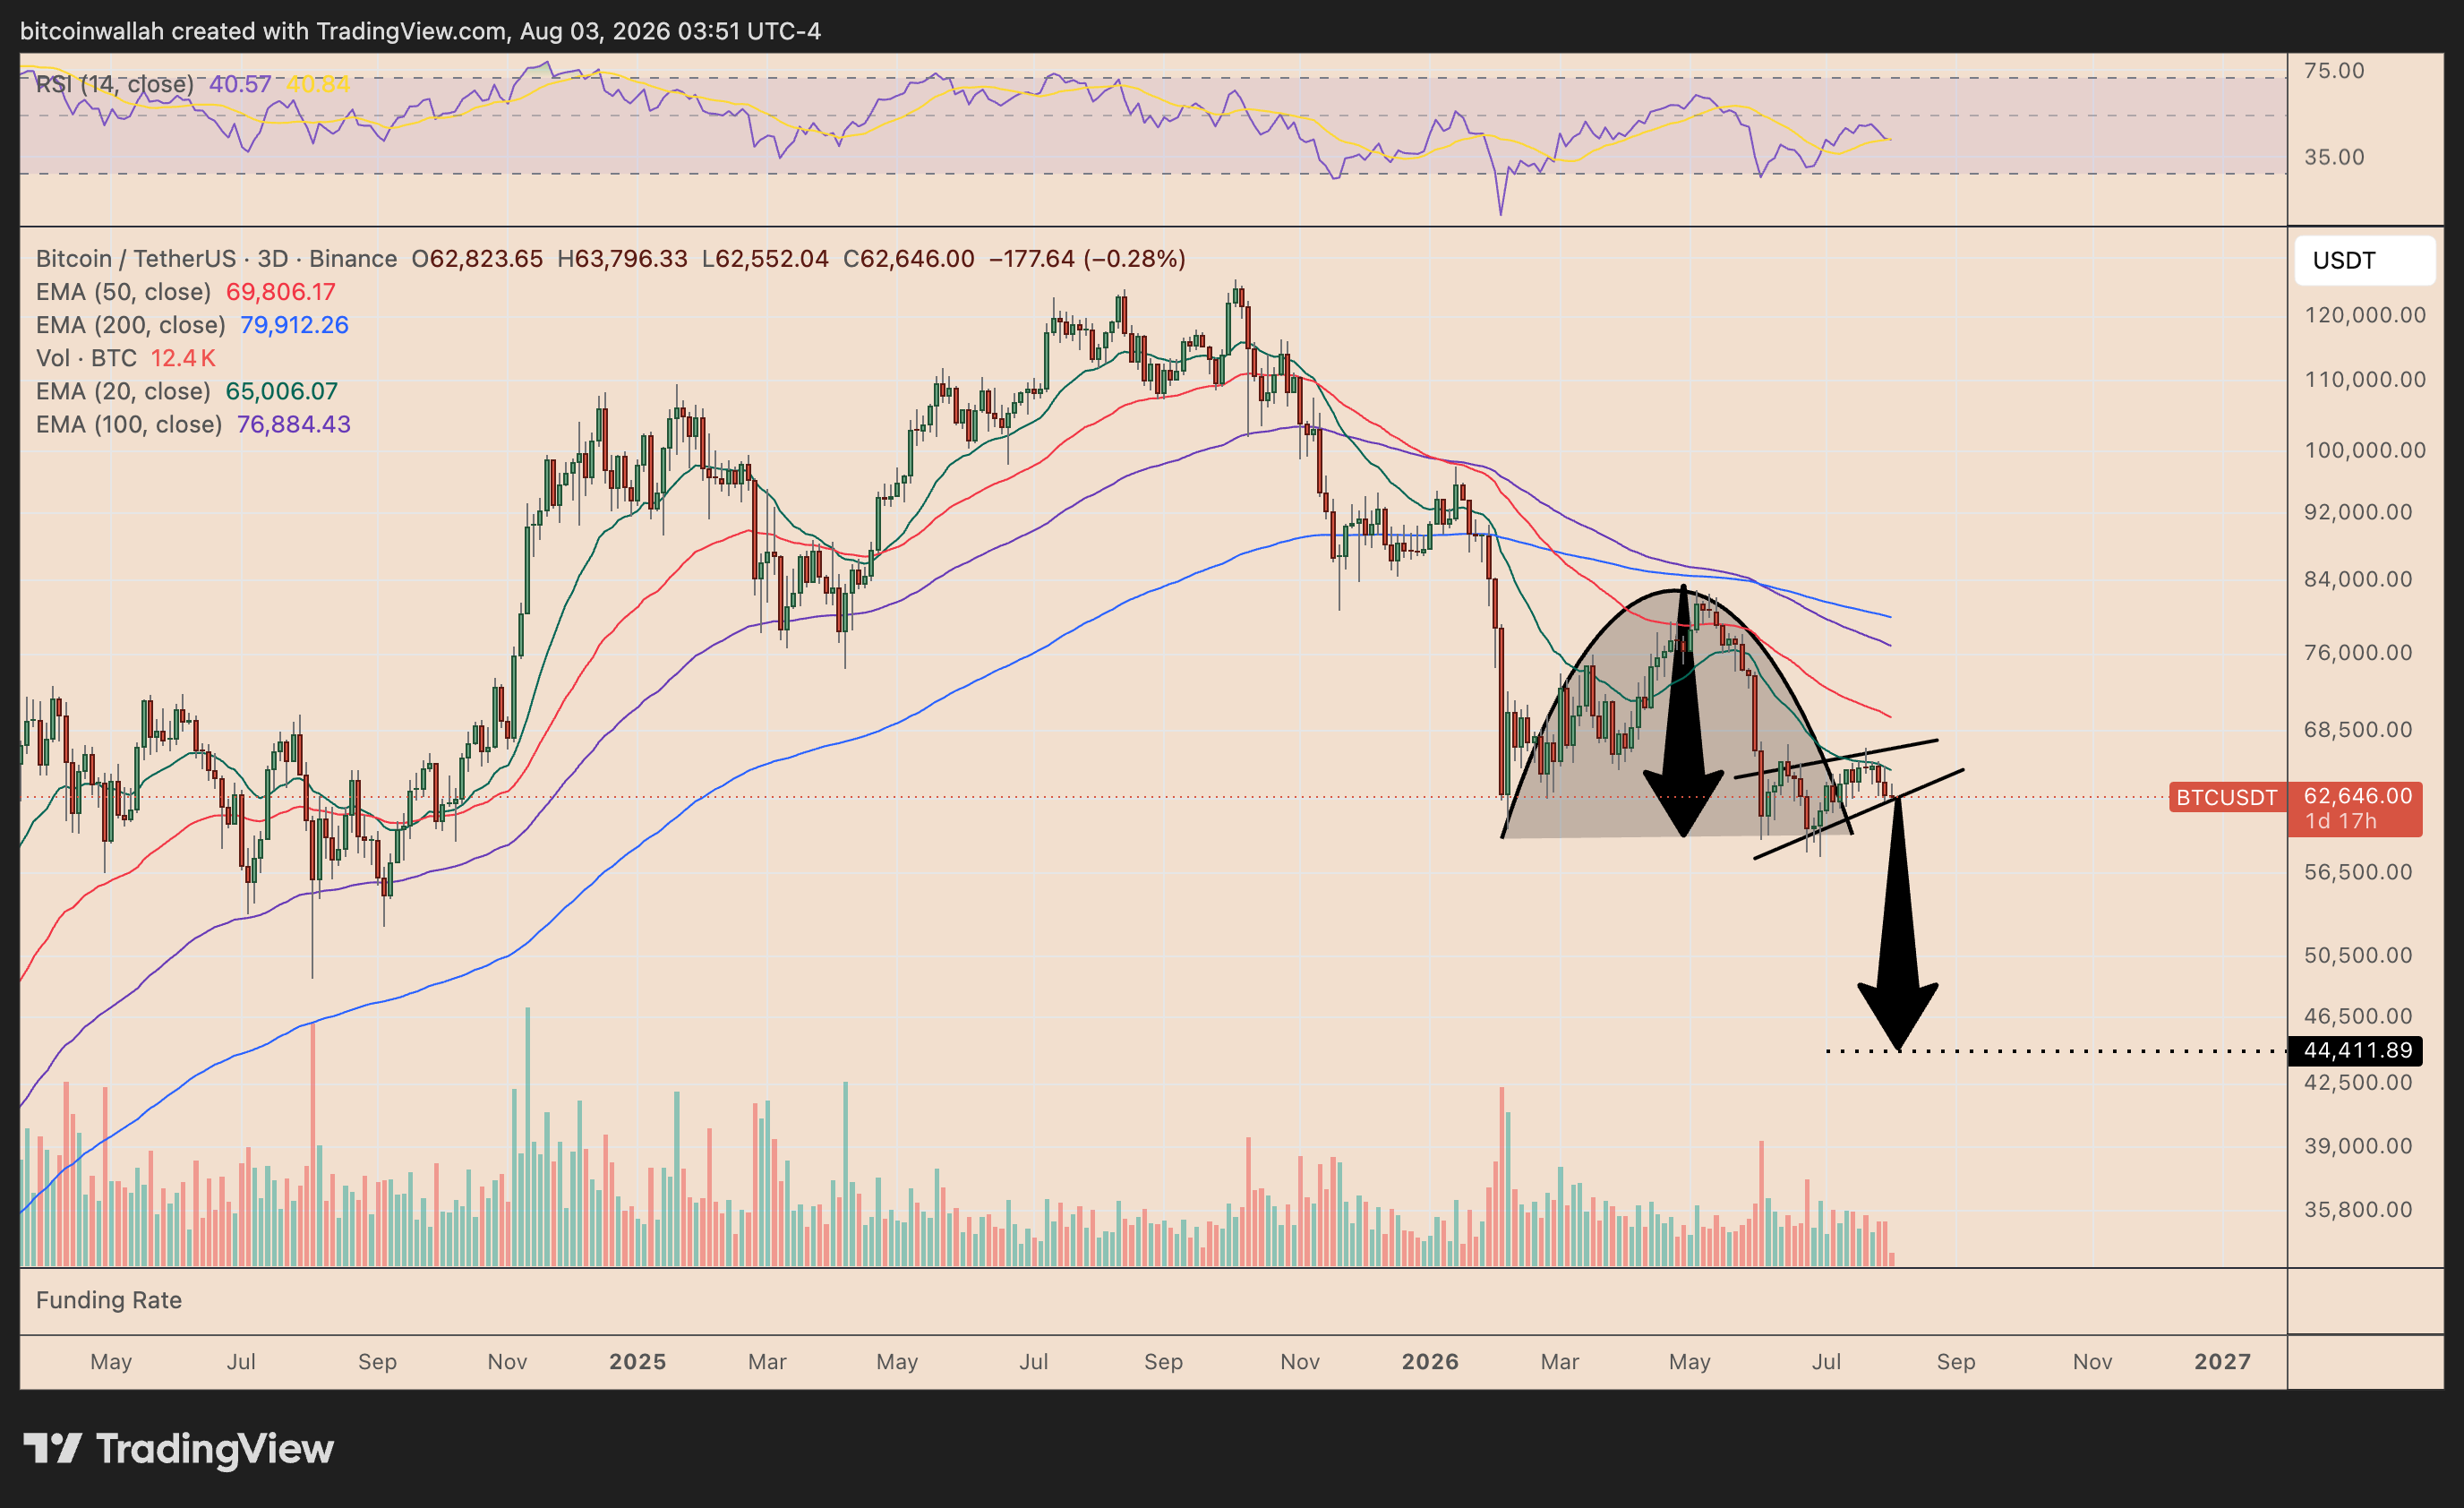
A decisive three-day close below the handle’s lower trendline near $59,000–$60,000 could confirm the breakdown. Measuring the pattern’s height from the rounded top and subtracting it from the breakdown area produces a downside target near $44,400.
That would place Bitcoin below $45,000 and represent an approximately 29% decline from current levels.
The setup would weaken if BTC breaks above the handle resistance and reclaims the $68,500–$70,000 region.
Security and Macro Risks Reinforce Bitcoin’s Bearish Setup
The technical risk is emerging alongside several fundamental pressures that could strengthen the case for a decline below $45,000.
A vulnerability affecting weak keys generated by a 2021 Coldcard firmware version reportedly enabled attackers to drain about 1,367 BTC, worth nearly $89 million, from more than 4,500 addresses.
🚨 BREAKING: THE WORST HARDWARE WALLET HACK IN BITCOIN HISTORY!!!
$38M drained from 500 cold wallets in 25 minutes. The attacker never touched a single device.
If you are a Coldcard Mk3 owner, move your coins today.
Quick version of what happened:
594 BTC drained from ~500… https://t.co/2AaB3DrdPk pic.twitter.com/QgpMlCSqpI
— Evan Luthra (@EvanLuthra) July 31, 2026
The exploit did not compromise the Bitcoin network itself, but it has renewed concerns about self-custody security and may further weaken investor confidence.
Meanwhile, the Japanese yen has strengthened following rare coordinated intervention by Japan and the US.
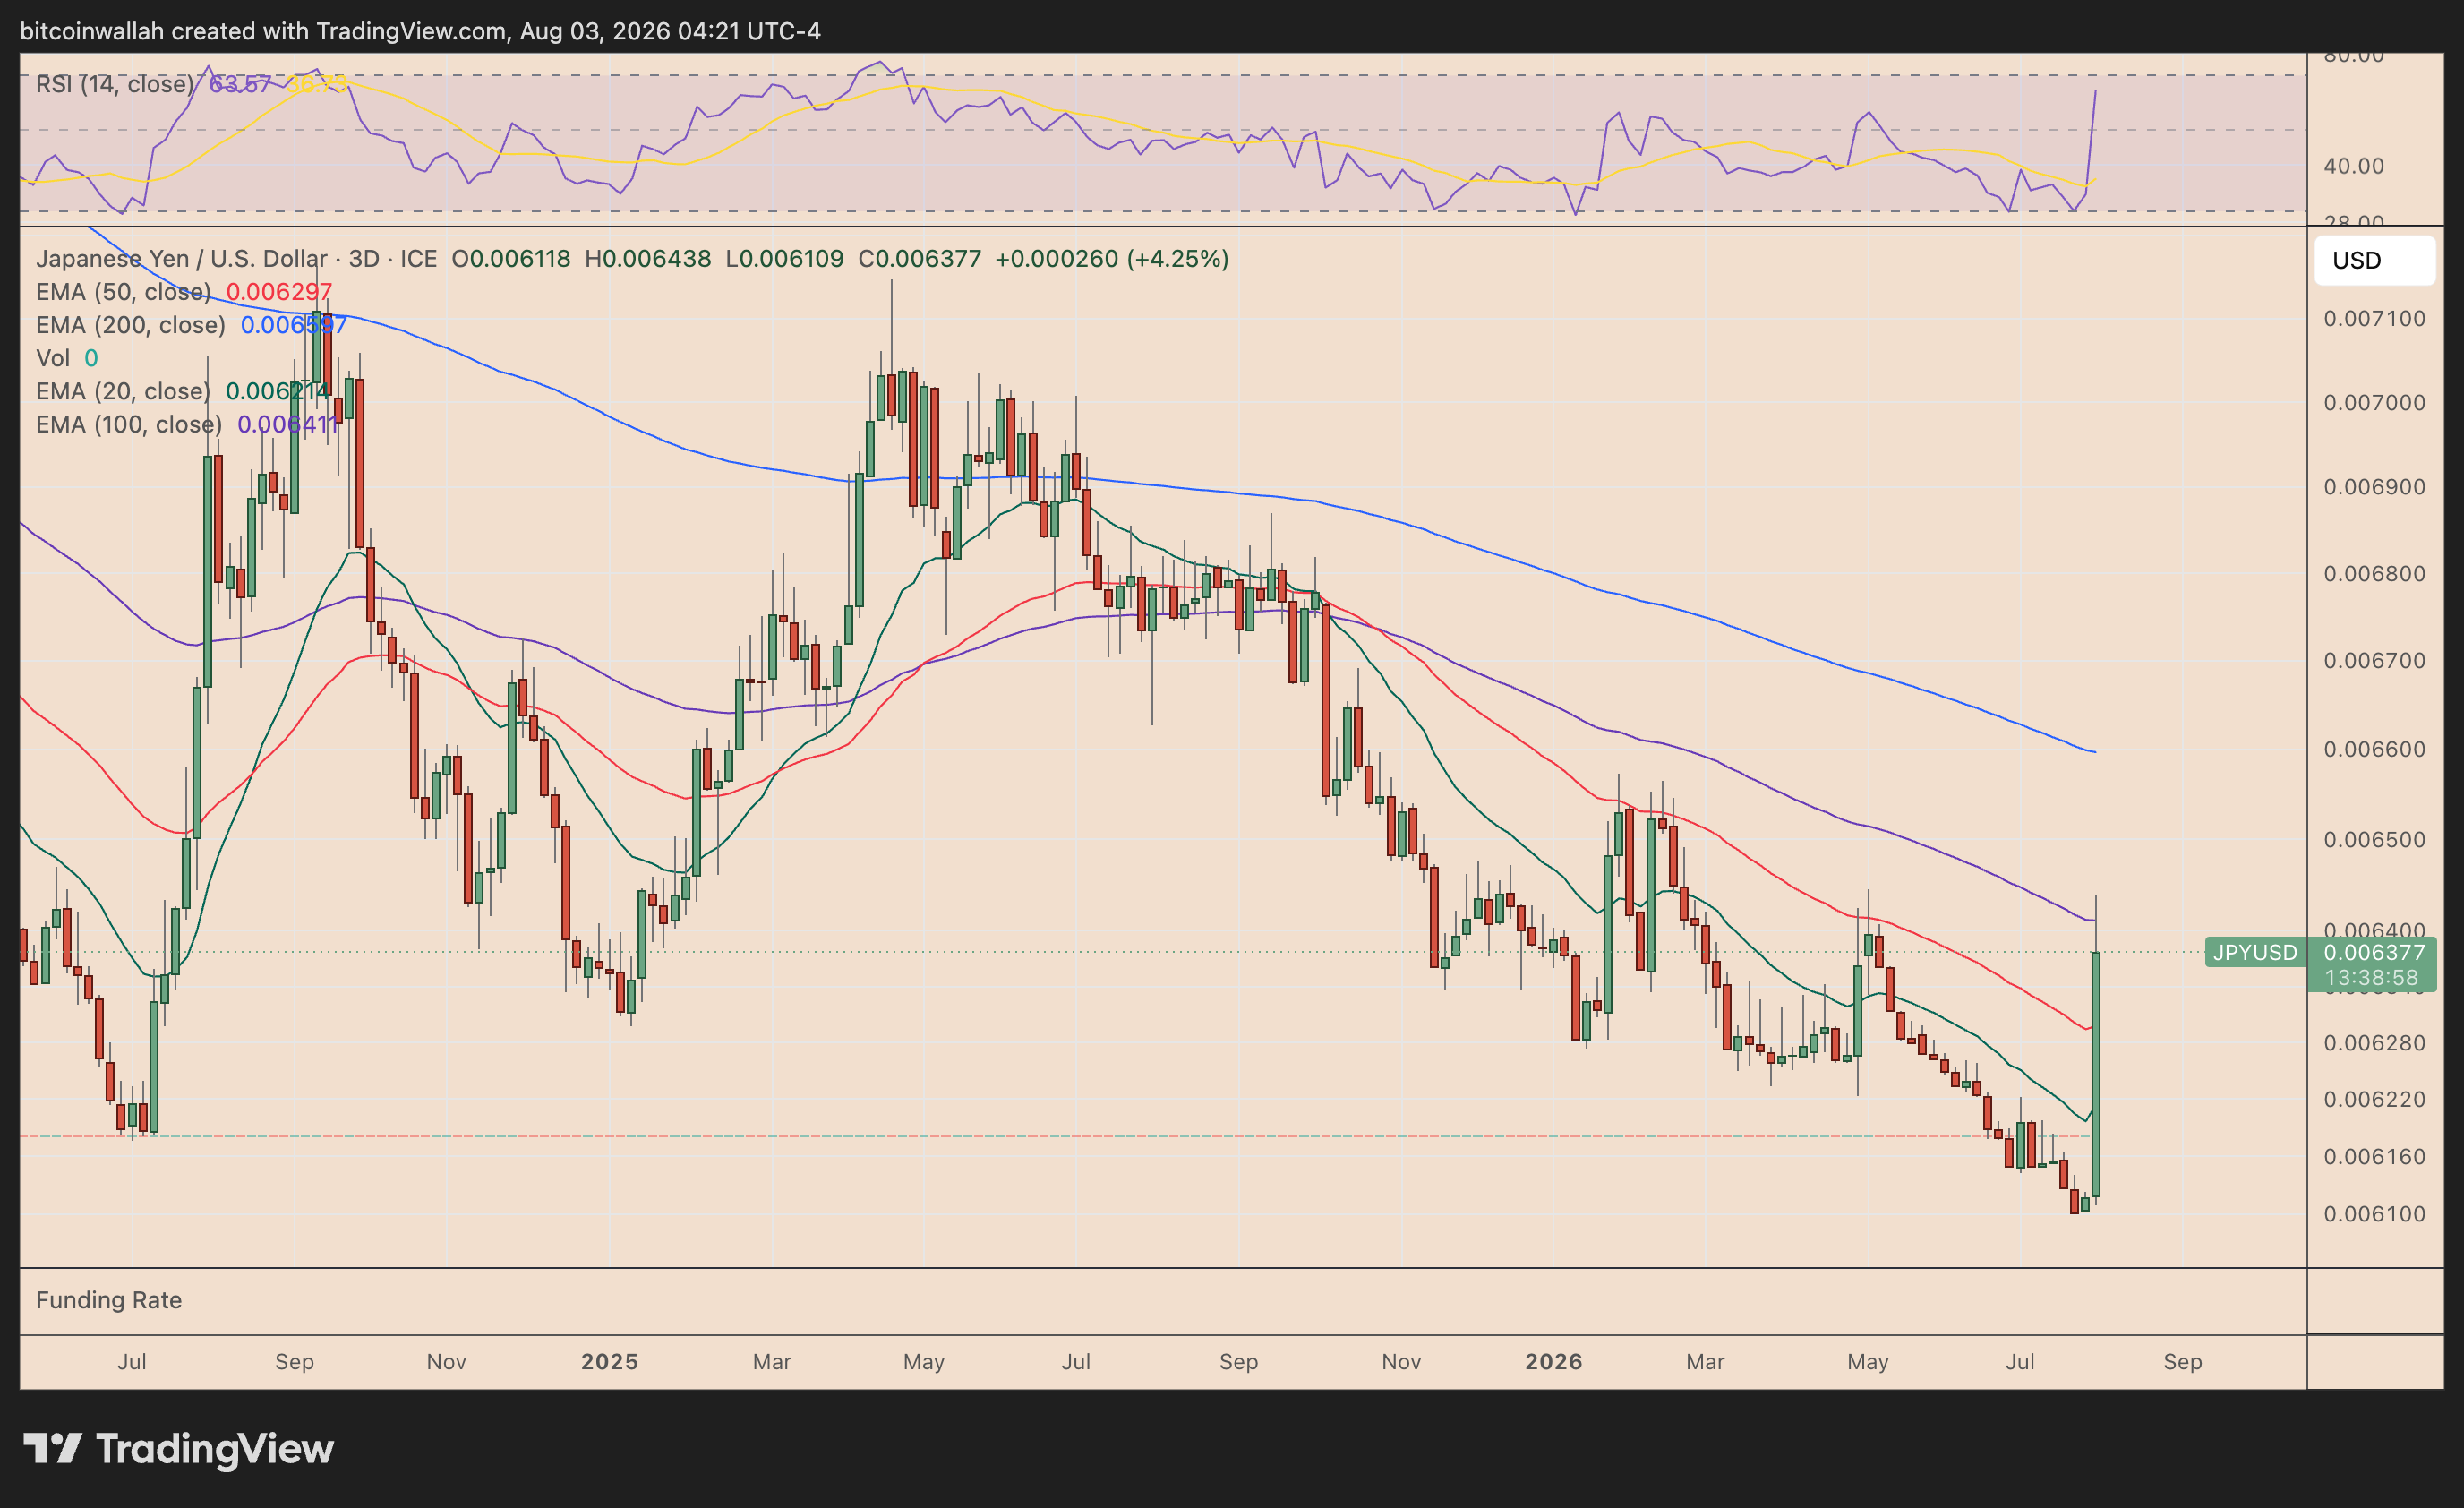
A sustained yen rebound could accelerate the unwinding of yen-funded carry trades, forcing leveraged investors to reduce exposure to risk assets such as equities and cryptocurrencies.
The Bank of Japan’s policy rate already stands near 1%, adding to concerns that tighter financial conditions in Japan could drain global liquidity.
The Federal Reserve remains another headwind.
CME FedWatch data showed traders pricing in roughly a 64.6% probability of a 25-basis-point rate hike in September, up from 55.7% a week earlier.
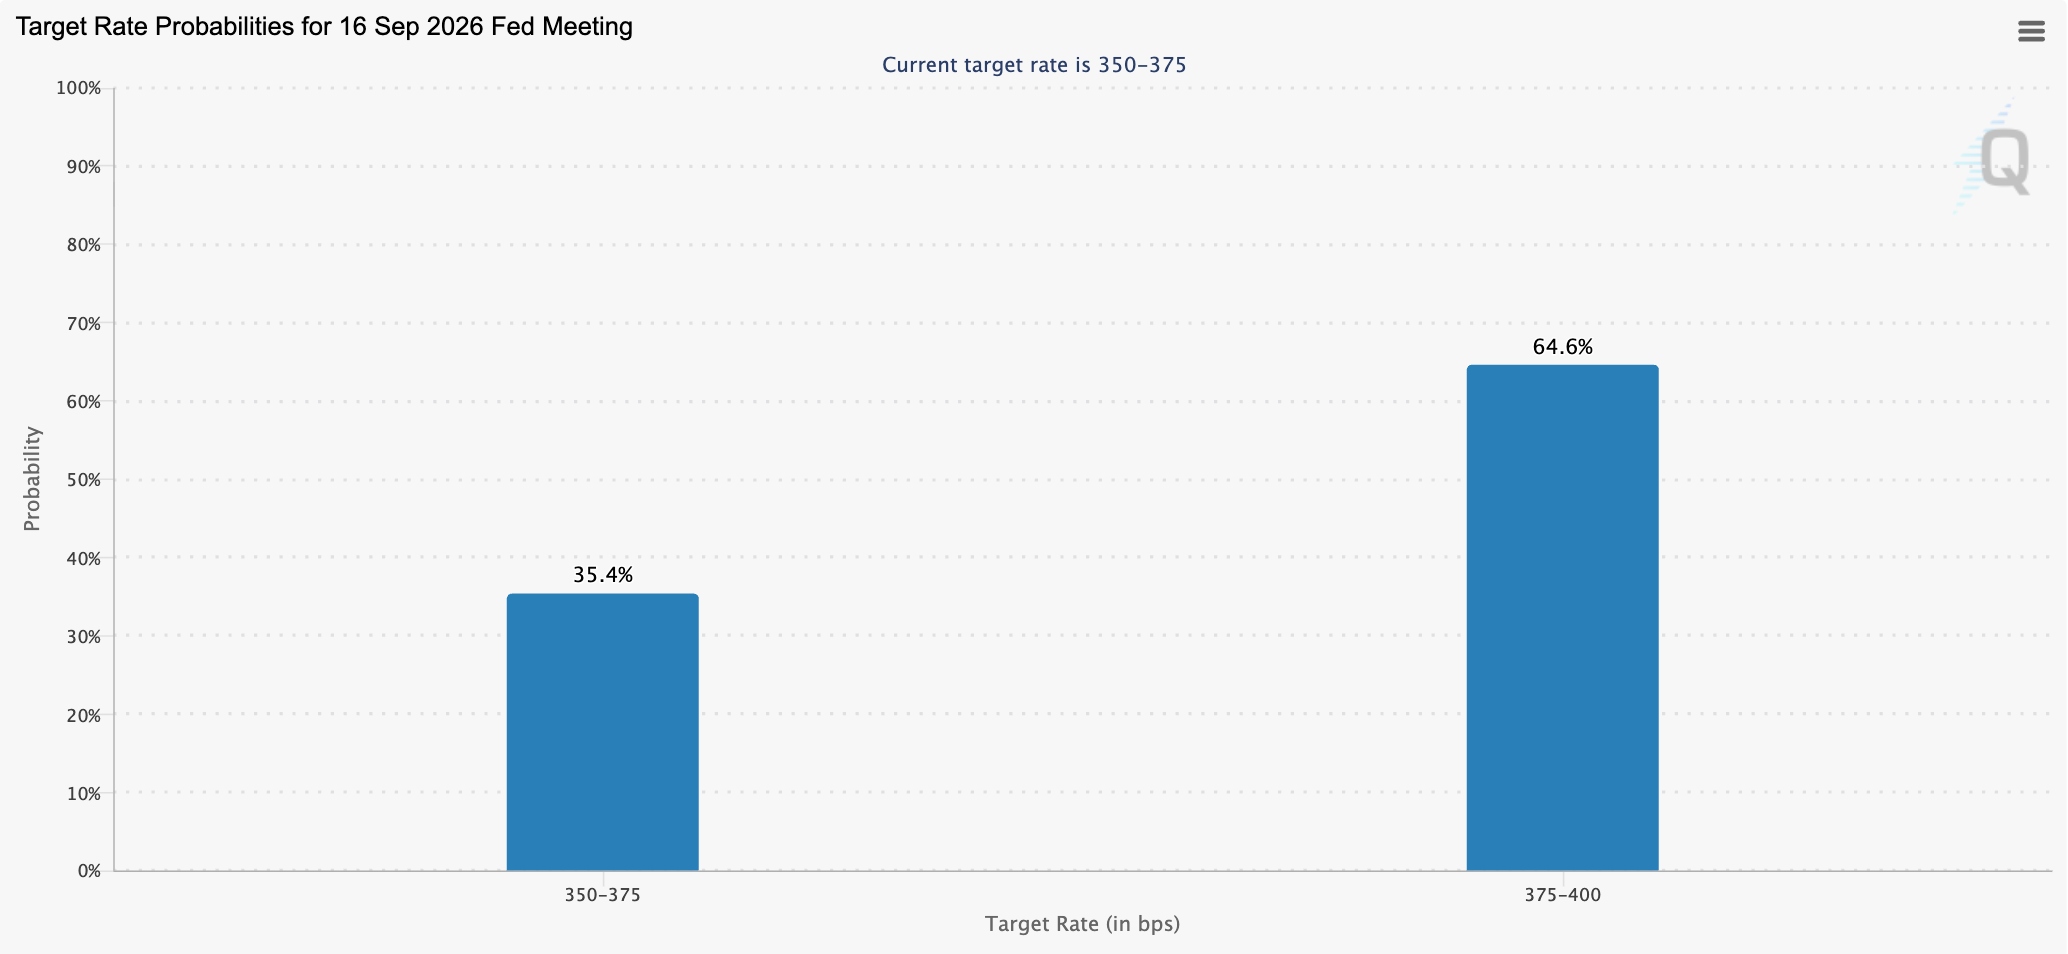
Rising expectations for rate hikes could tighten financial conditions, lift yields, and reduce demand for risk assets such as Bitcoin.