TSLA Technical Analysis
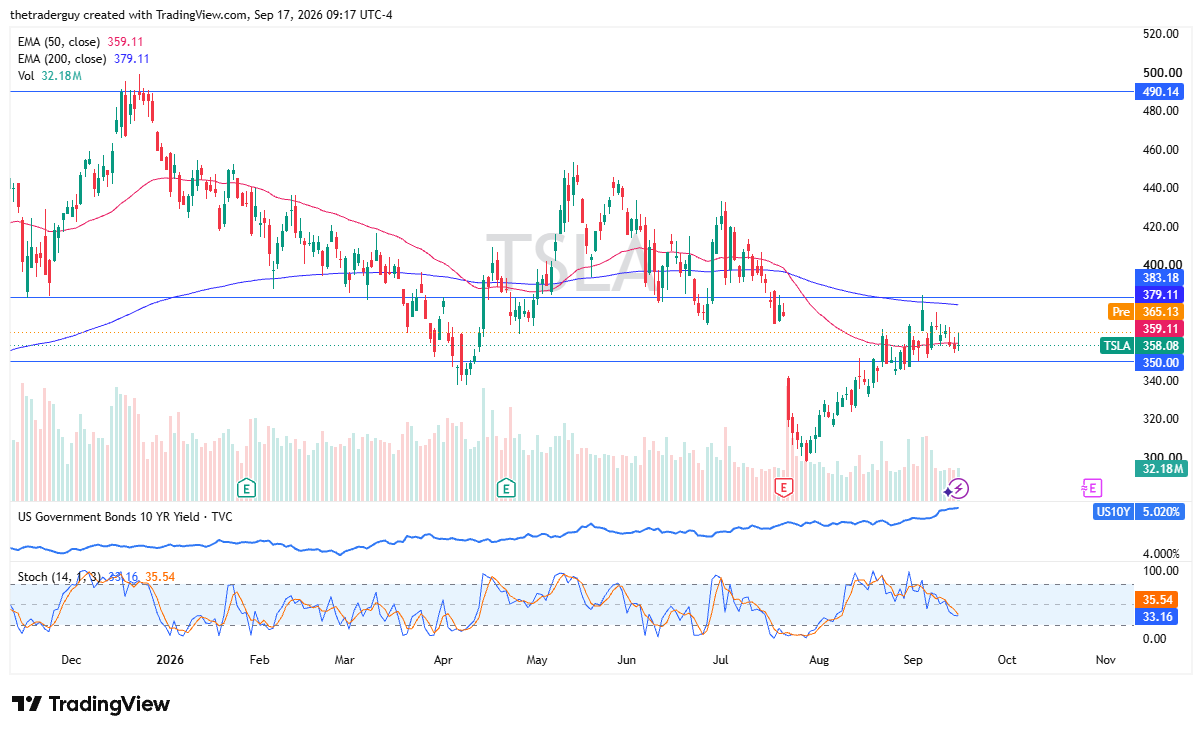
Tesla looks like it’s going to jump at the open here based on pre-market trading on Thursday. After the Federal Reserve raised interest rates, it appears that, in general, we’re seeing more risk appetite flow back into the stock market. It looks like the U.S. economy is being paid attention to. As the Federal Reserve stated, the strength of the U.S. economy was a bit surprising.
In this environment, that does seem to lift all boats, and Tesla is currently trying to take advantage of that. The 200-day EMA sits at $379.11, so keep that in mind as a potential barrier.

NVDA Technical Analysis
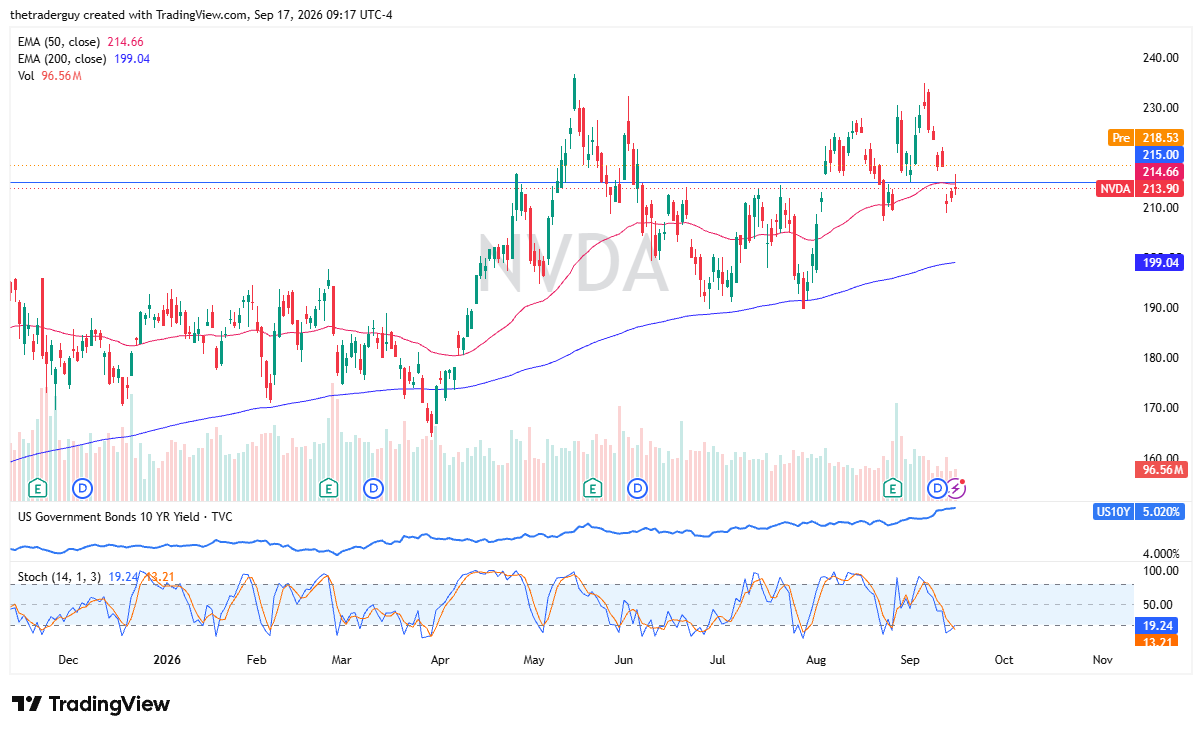
NVIDIA looks like it’s going to jump right away. It’s up about $5 in pre-market trading, and it is crossing out of the oversold condition on the stochastic oscillator, jumping above that crucial $215 level. Now, it looks like it’s going to open, filling the gap from a couple of sessions ago.
Ultimately, NVIDIA is all about the AI play. The AI play seems to be doing fairly well in pre-market trading, so it looks pretty healthy.
MSFT Technical Analysis
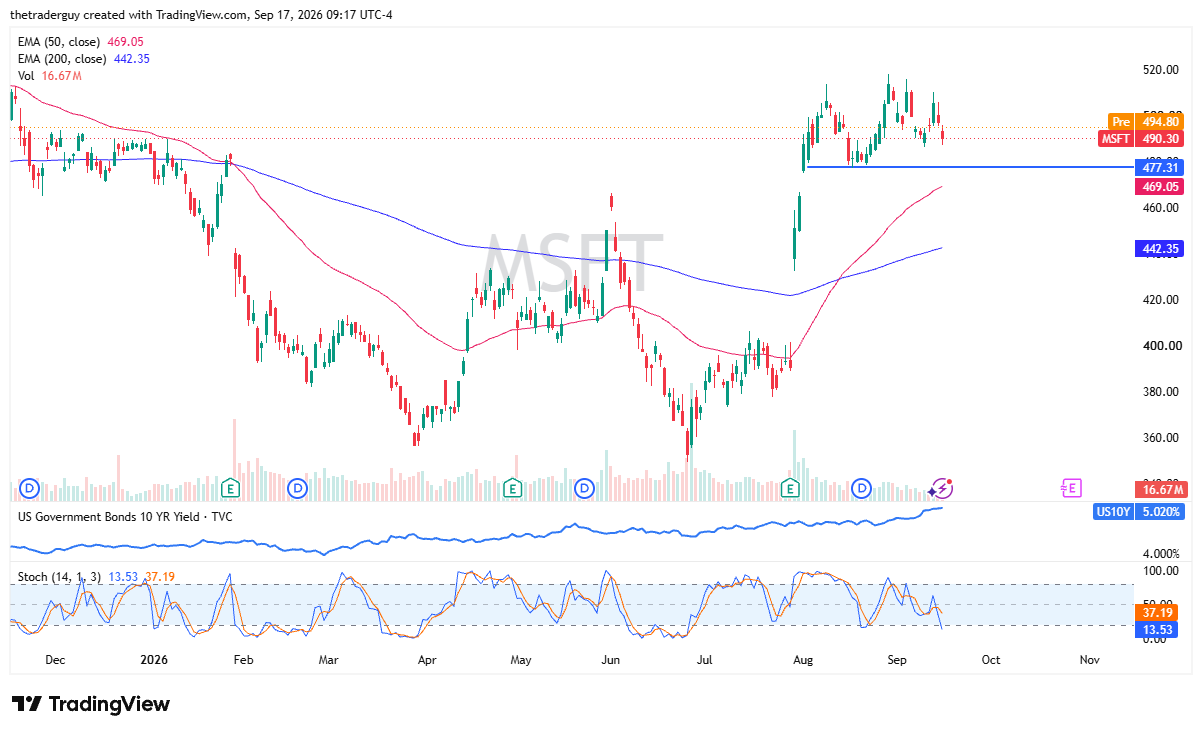
Microsoft looks like it’s going to jump as well, opening about $5 higher than it closed. Microsoft’s been on fire for a while. It seems like it has a massive amount of support near the $477.31 level. We are well above there, but we are below that $515 barrier.
Ultimately, though, it does look like the buyers are returning, at least for a day or two, as we continue to see consolidation with more of a bullish tilt than anything else. This is a market that looks like it is trying to build momentum for another bullish move at the moment.
If you’d like to know more about technical analysis and how traders use it, please visit our educational area.