
Advertisement
Advertisement
Comex Gold Futures (GC) Technical Analysis – August 31, 2015 Forecast
By:
December Comex Gold futures rallied on Friday. Since the U.S. Dollar was stronger, the move was likely related to short-covering. The chart pattern
December Comex Gold futures rallied on Friday. Since the U.S. Dollar was stronger, the move was likely related to short-covering. The chart pattern suggests that shorts came in to cover their positions after enough selling pressure failed to come in to drive the market through a key uptrending support angle.
This week could feature the return of volatility because of Friday’s U.S. Non-Farm Payrolls report. On Friday and over the week-end, Fed Vice Chair Stanley Fischer made comments that could be perceived as hawkish. Fischer said that the Fed is aware of the recent turmoil in the markets, but that it is mainly concerned about the improving labor and inflation data.
Although Fischer said the Fed is on track to raise rates in 2015, a stronger-than-expected jobs report on Friday could move up the timetable for a rate hike. Gold could weaken if investors begin to price in the possibility of a September rate hike once again.
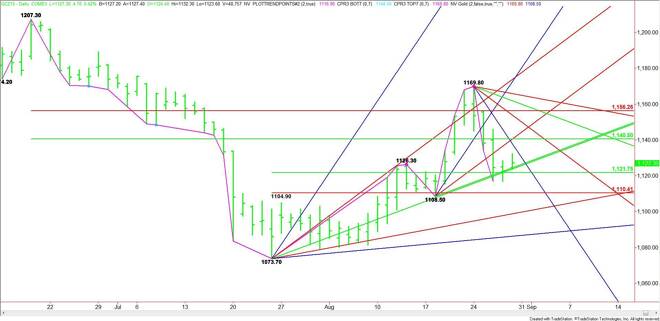
Technically, the main trend is up according to the daily swing chart. The main range is $1207.30 to $1073.70. Its retracement zone is $1140.50 to $1156.20. This zone should be considered resistance since it eventually stopped the rally last week.
The short-term range is $1073.70 to $1169.80. Its retracement zone is $1121.70 to $1110.40. This zone was tested successfully last week when the selling pressure stopped at $1116.90.
On the downside, the key support is a pair of uptrending angles at $1126.50 to $1125.70. These angles are controlling the direction of the market. The downtrending angle that stopped the rally on Friday drops in at $1129.80.
Let’s look at the downside first. A failure to hold $1125.70 will signal the presence of buyers. This should lead to another test of the 50% level at $1121.70.
The daily chart opens up to the downside under $1121.70 with the next target a low at $1116.90 and a Fibonacci level at $1110.40.
A trade through $1108.50 will turn the main trend to down. This should trigger a further break into the next major uptrending angle at $1099.70.
Based on the close at $1134.00, the first upside target is the major 50% level at $1140.50. This level stopped the rally on Friday. The next two targets over this level are $1144.50 and $1149.80. This is followed by the major Fibonacci level at $1156.30.
Watch the price action and order flow at $1140.50. This will tell us whether the bulls or the bears are in control.
About the Author
James Hyerczykauthor
James Hyerczyk is a U.S. based seasoned technical analyst and educator with over 40 years of experience in market analysis and trading, specializing in chart patterns and price movement. He is the author of two books on technical analysis and has a background in both futures and stock markets.


Advertisement