WTI Crude Oil The WTI Crude Oil market initially went sideways during the trading session on Tuesday, but then pulled back slightly to find support
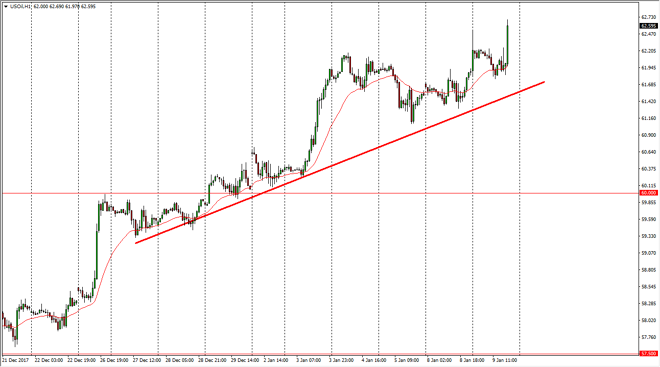
The WTI Crude Oil market initially went sideways during the trading session on Tuesday, but then pulled back slightly to find support underneath. By doing so, the market continues the uptrend, breaking above the $62.50 level. I think at this point, we will probably continue to go to the upside, perhaps reaching towards the $63 level next, and then eventually the $65 level which I think is much more significant resistance. The uptrend line on the chart has held rather significantly, and I think that continues to be the story here: buying on the dips. I believe that the “floor” in the short-term trend to the upside is probably the $60 handle. I expect volatility, because there are a lot of conflicting areas of interest when it comes to crude oil, as the OPEC and Russian governments have suggested that they are going to cut back on production, and of course there are concerns about any type of tension in the Middle East. Beyond that though, and the opposite direction we have American shale producers getting ready to jump all over the high price.
Brent markets also rallied, as we continue to see a lot of buying pressure, sending the market towards the $70 handle. I think that the market should continue to be one that you can buy on dips, at least in short chunks. I think that short-term trading is probably the best way to go, but with an upward bias. The uptrend line is very reliable, and I think that if we break down below it, the market could reach as low as $66, perhaps even $65. I believe that the $65 level is the “floor” of the uptrend right now, and if the US dollar starts to fall again, that could also help these markets.
Chris is a proprietary trader with more than 20 years of experience across various markets, including currencies, indices and commodities. As a senior analyst at FXEmpire since the website’s early days, he offers readers advanced market perspectives to navigate today’s financial landscape with confidence.