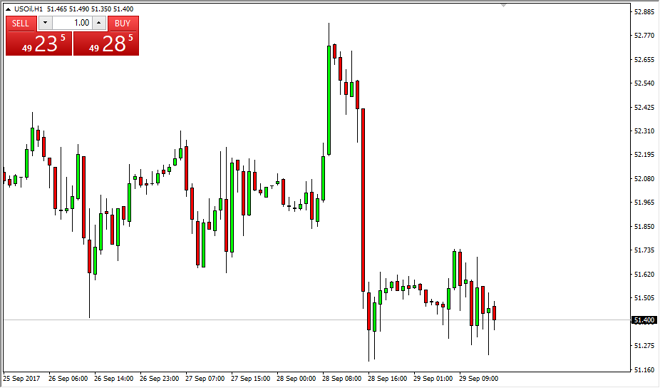
WTI Crude Oil The WTI Crude Oil market drifted lower on Friday, after selling off drastically on Thursday. The market is currently forming a shooting star
The WTI Crude Oil market drifted lower on Friday, after selling off drastically on Thursday. The market is currently forming a shooting star the weekly chart, and I think the more bearish pressure may present itself. The $50 level below should be massively supportive though, but if we break down below there things could get ugly rather quickly. With that, I think the market would probably go looking towards the $48 level next. Rallies from here will be treated with suspicion, as there is so much in the way of bearish pressure above. Overall, crude oil seems like you can’t get out of its own way, and we are starting to see bearish action in all petroleum markets.
Speaking of other petroleum markets, the Brent market gap lower at the open on Friday, and then continue to go lower. The weekly candle in the Brent market is a shooting star, and quite frankly it’s horrible looking shooting star. I think that the bread market is going to drag the rest of the petroleum sector down, and if you have an opportunity to short both of these markets, Brent is probably where you put your money first. At that point, I suspect that the market to go looking for $55, and possibly even $50 after that. Rallies of this point will be treated with a lot of suspicion as well, after the massive selloff that we have seen over the last couple of days. The Brent market continues to be very bearish and with the US dollar rallied overall, left going to continue to work against the value of oil anyway. With this, I remain a seller, have no interest in buying, least not anytime soon as the oversupply continues to cause issues.
Chris is a proprietary trader with more than 20 years of experience across various markets, including currencies, indices and commodities. As a senior analyst at FXEmpire since the website’s early days, he offers readers advanced market perspectives to navigate today’s financial landscape with confidence.