


Dogecoin (DOGE) has experienced a 7% loss in the past 30 days, outpacing other top tokens like Bitcoin (BTC) and Ethereum (ETH) during this period, as the market’s interest in altcoins continues to be weak.
The top memecoins have had a pretty rough year. After losing the 10 cents support area, the token retreated by another 30%, indicating persistent selling pressure.
With no floor in sight, Dogecoin’s outlook seems dire as it has now formed a bearish price setup that could result in a 19% drop for the token if confirmed.
A hawkish Federal Reserve in the United States is one of the reasons why investors have dumped DOGE this year. In an environment where analysts expect future interest rate hikes, low-risk assets are offering a more attractive risk-reward ratio than niche cryptocurrencies.
Moreover, retail investors, the primary force behind Dogecoin’s rise to the top of the ranks, have been heavily battered during this bear market and sentiment among this cohort remains heavily depressed.
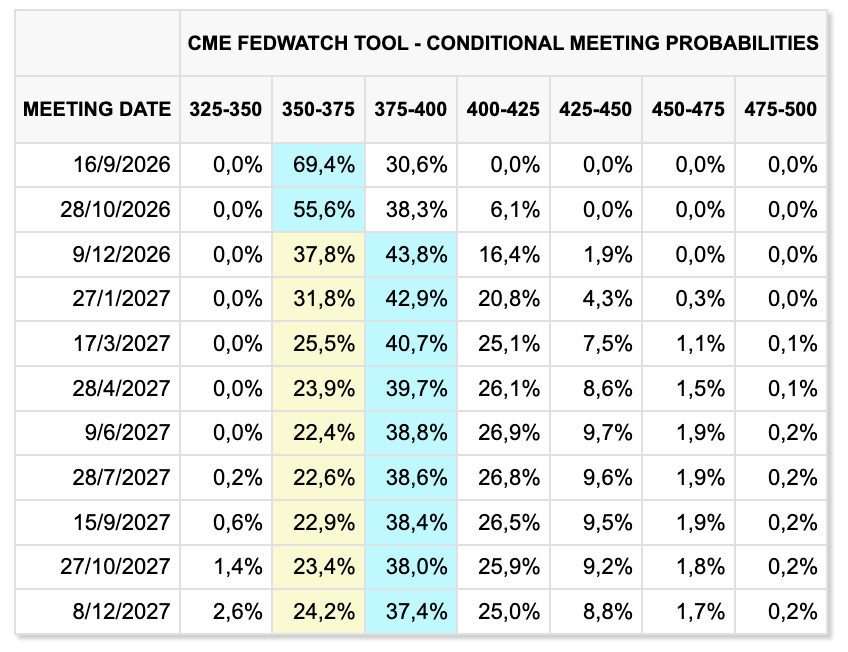
Even though inflation retreated in the United States last month, analysts still expect that the Fed will maintain its hawkish stance on rates, meaning no relief for the crypto market yet.
In addition, persistent geopolitical tensions, paired with increased interest in other segments of the tech space like space travel and artificial intelligence (AI), continue to weigh on the performance of these tokens in the near term.
Low Volumes Increase Downside Risks for DOGE
Data from Santiment shows that trading volumes for Dogecoin have dipped to their lowest level since July 2024, just a few months before President Donald Trump was elected.
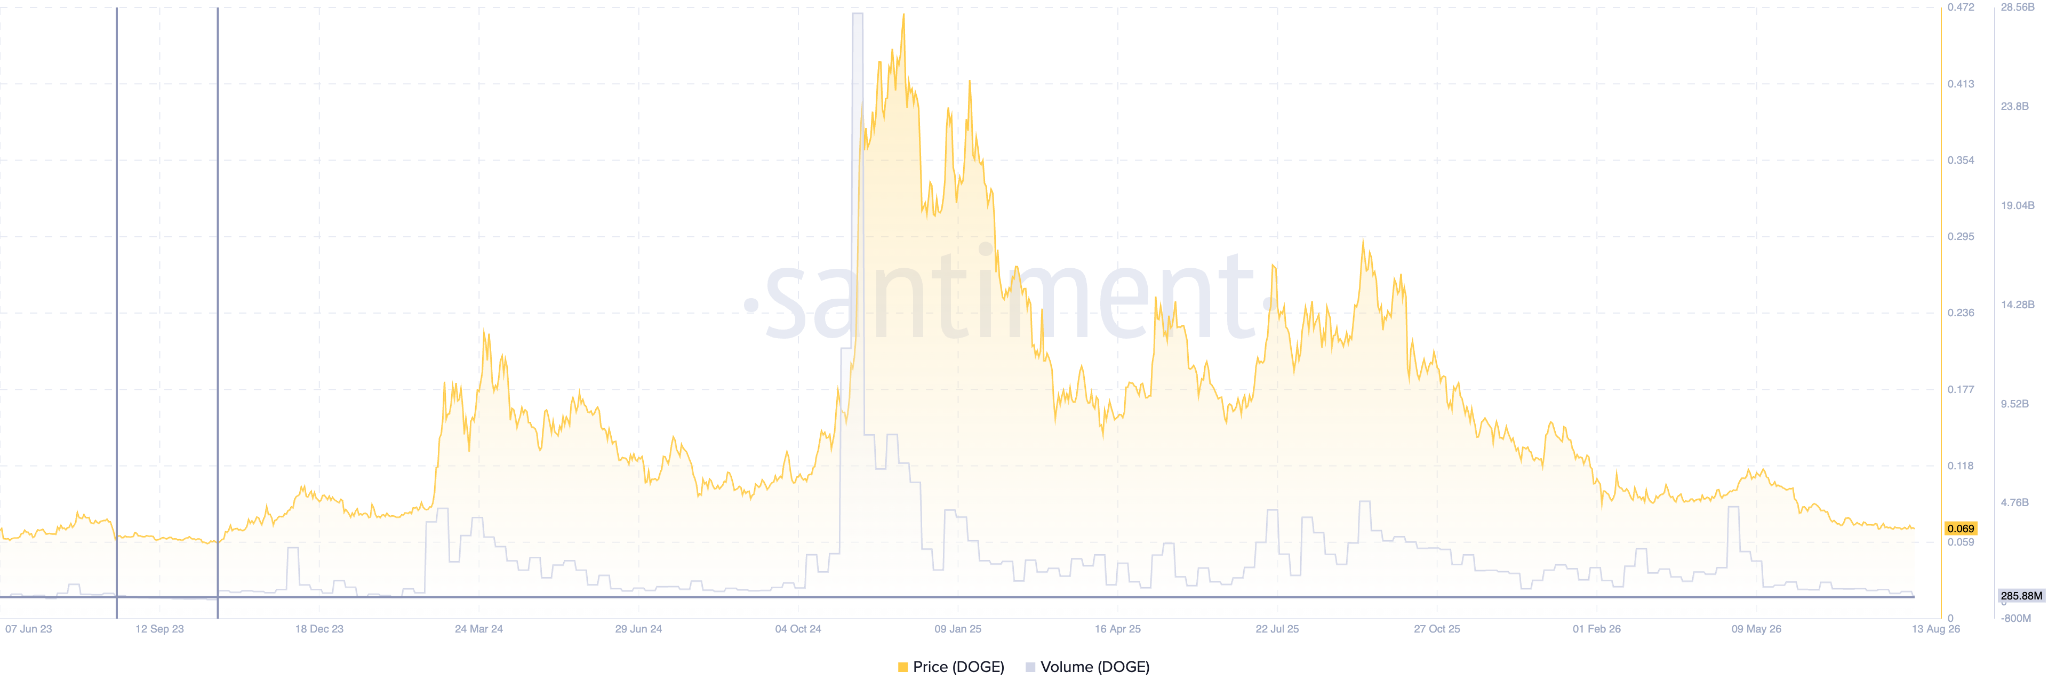
This could set the stage for a pronounced decline to the levels at which DOGE traded back then at a point when interest in this token remains quite weak.
Between October and December 2023, back when volumes were this low, the token hit a cycle low of around $0.058 and started to recover right after.
Hence, we expect a similar drop during this cycle as volumes seem to be indicating that the selling spree will continue amid a clear absence of willing buyers. The market will likely need to revisit these low levels to find liquidity and fill orders. That’s just how the market works.
Dogecoin Price Forecast
Every new Dogecoin analysis as it publishes, today's technical signal and key levels, live price — on one page.
See all Dogecoin forecastsDogecoin Could Drop to $0.058 If This Happens
Heading to the daily chart, we can see that a bearish flag pattern has formed. This is a continuation setup that tends to indicate a temporary pause after a pronounced uptrend or downtrend.
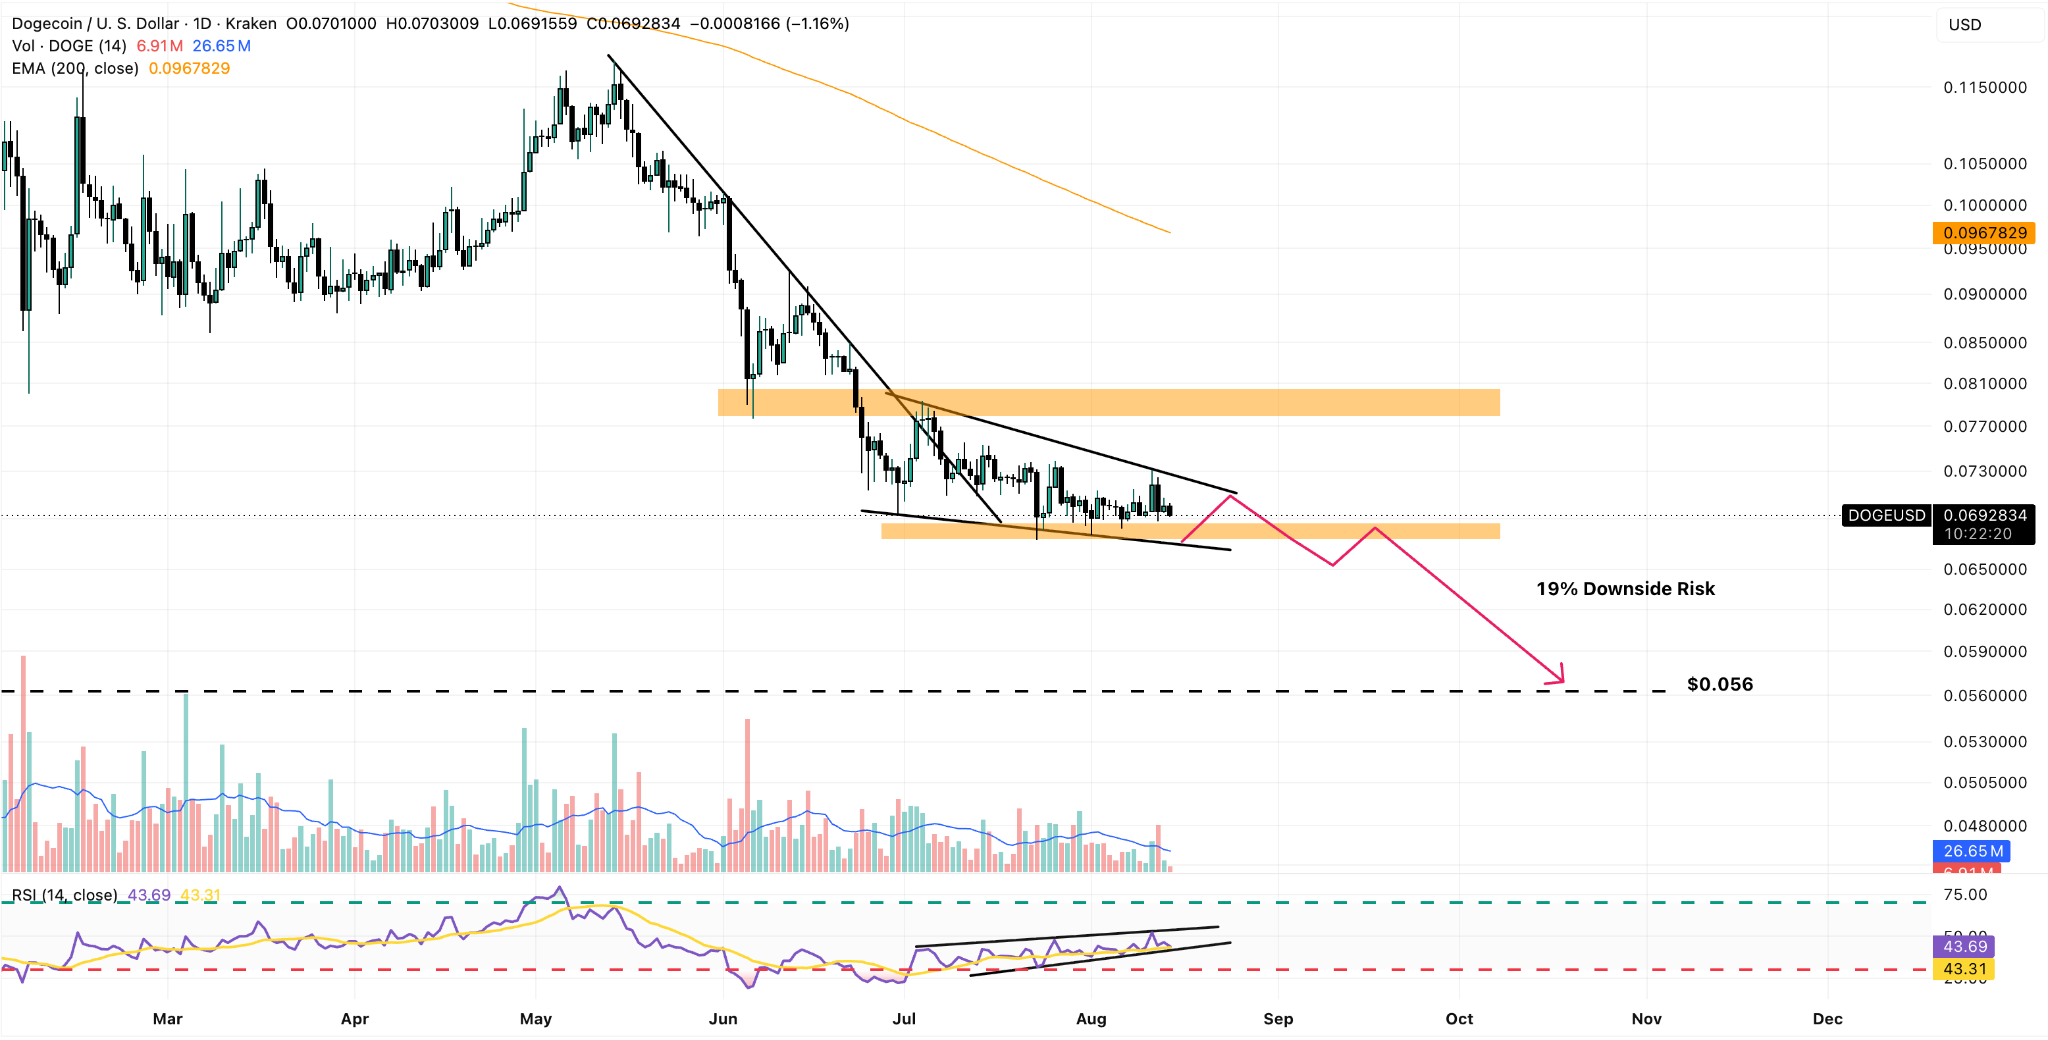
The slight downward tilt that the pattern exhibits is typical of continuation patterns. The price declines at a slower pace until a key support is broken. Once that happens, the downtrend accelerates toward the next bearish target.
We see the $0.058 area as the key support to watch once again if that bearish breakout happens. This means a 19% downside risk based on where DOGE is currently trading at.
Interestingly, we are seeing a slight bullish divergence in the Relative Strength Index (RSI) as the oscillator has been rising even though the price has kept dropping.
However, this is just indicative that the previous downtrend has lost strength, but it does not necessarily mean that it is over.