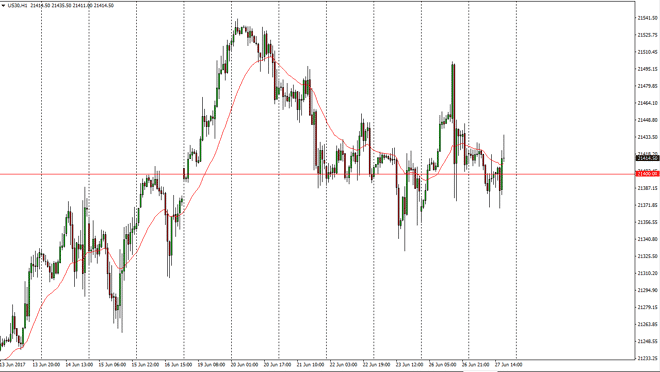
Dow Jones 30 The Dow Jones 30 fell twice during the day on Tuesday, but continues to find support near the 21,370 level. Ultimately, if we can break out
The Dow Jones 30 fell twice during the day on Tuesday, but continues to find support near the 21,370 level. Ultimately, if we can break out above the top of the range during the session on Tuesday, I believe that the market continues to go to the upside, perhaps reaching towards the 21,500 level. The market then could break out to the upside. Short-term pullbacks continue to be buying opportunities as the market has quite a bit of bullish pressure underneath and of course we have a significant amount of good news coming out of the stock market in general, and that of course sends the market looking for the 21,500 level. I think that given enough time the buyers will return as we continue to have very little in the way of interest rates offering returns.
The NASDAQ 100 fell during the day on Tuesday, testing the 5725 level but bouncing slightly. I believe that given enough time the buyers could return to this market as it looks like we are in a bit of an uptrend in general. With this, I think the market then goes looking for the 5850 level. The market continues to find value hunters, and as such I have no interest in shorting, least not until we break well below the 5700 level. Longer-term, I still believe that we are to go hunting for the 6000 level, but of course the 5800 and the 5900 level will be a significant target for traders to be looking for as we have been in an uptrend for some time and of course large round numbers attract a lot of attention. The NASDAQ 100 had been a leader of the US indices over the longer term, and I think that should continue to be the case going forward.
Chris is a proprietary trader with more than 20 years of experience across various markets, including currencies, indices and commodities. As a senior analyst at FXEmpire since the website’s early days, he offers readers advanced market perspectives to navigate today’s financial landscape with confidence.