
Advertisement
Advertisement
E-mini NASDAQ-100 Index (NQ) Futures Technical Analysis – October 9, 2014 Forecast
By:
Short-sellers tried, but failed to reaffirm the downtrend by taking out the recent swing bottom at 3927.75 on Wednesday. The subsequent short-covering
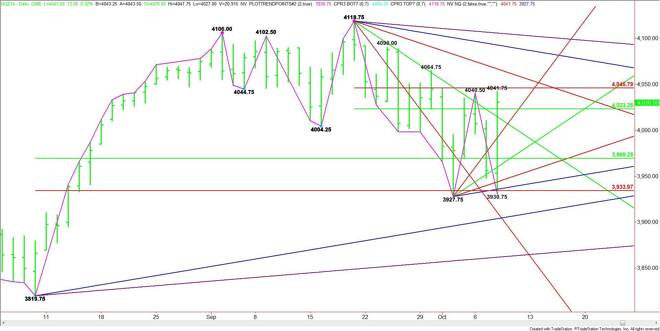
Short-sellers tried, but failed to reaffirm the downtrend by taking out the recent swing bottom at 3927.75 on Wednesday. The subsequent short-covering rally triggered a massive move through the swing top at 4040.50, turning the main trend to up on the daily chart.
Before we see another upside breakout, however, buyers must be able to take out the Fibonacci level of a major retracement zone. Based on the strong momentum into the close, buyers are likely to attempt to do this early in the session.
The main range is 4118.75 to 3927.75. Its retracement zone is 4023.25 to 4045.75. On Wednesday, the index closed inside this zone at 4030.50. Yesterday’s high at 4041.75 fell short of taking out the upper, or Fibonacci level at 4045.75.
Overcoming 4045.75 today should fuel a fast rally into the next downtrending angle at 4062.75. This is followed by angles at 4090.75 and 4104.75. The final angle is the last resistance before the contract high at 4118.75.
The first sign of weakness today will be a break under the 50% level at 4023.25. This could trigger a test of an uptrending angle at 4007.75. The daily chart opens up to the downside under this angle with potential targets at 3967.75, 3947.75 and 3937.75.
Crossing to the weak side of a downtrending angle at 4006.75 will also be a sign of selling pressure.
The key area to watch today appears to be 4007.75 to 4006.75. Trader reaction to this area should set the tone for the day. Since there are no major clusters today, look for volatility because the support and resistance levels are widely staggered.
For those looking for simple analysis, look for an upside bias over 4045.75 and a down side bias under 4023.25.
About the Author
James Hyerczykauthor
James Hyerczyk is a U.S. based seasoned technical analyst and educator with over 40 years of experience in market analysis and trading, specializing in chart patterns and price movement. He is the author of two books on technical analysis and has a background in both futures and stock markets.


Advertisement