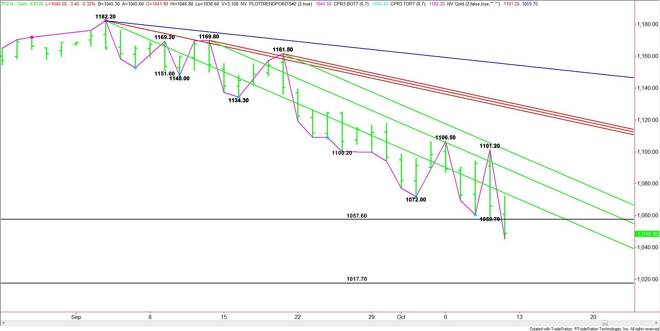
The December E-mini Russell 2000 Index closed on the bearish side of a major bottom at 1057.60. The daily chart indicates there is plenty of room to the
The December E-mini Russell 2000 Index closed on the bearish side of a major bottom at 1057.60. The daily chart indicates there is plenty of room to the downside with 1017.70 the next likely downside target.
The main trend is down on the daily chart. The main trend will turn back up on a trade through the previous two main tops at 1101.20 and 1106.50.
Retaking the former bottom at 1057.60 will indicate short-covering. This could lead to rallies into downtrending angles at 1070.20, 1085.80 and 1097.50 before attempting to breakout over the main tops at 1101.20 and 1106.50.
The market is oversold on the daily chart, but not showing any signs of bottoming. Traders, however, have to watch for a short-covering rally. Aggressive counter-trend traders may want to play the long side, however, those that are short have to avoid getting caught if the market turns or risk giving back most of their profit. If the stock market is getting close to a bottom, the bottoming action is likely to first show up in the Russell futures contract.
James Hyerczyk is a U.S. based seasoned technical analyst and educator with over 40 years of experience in market analysis and trading, specializing in chart patterns and price movement. He is the author of two books on technical analysis and has a background in both futures and stock markets.