Key Insights:
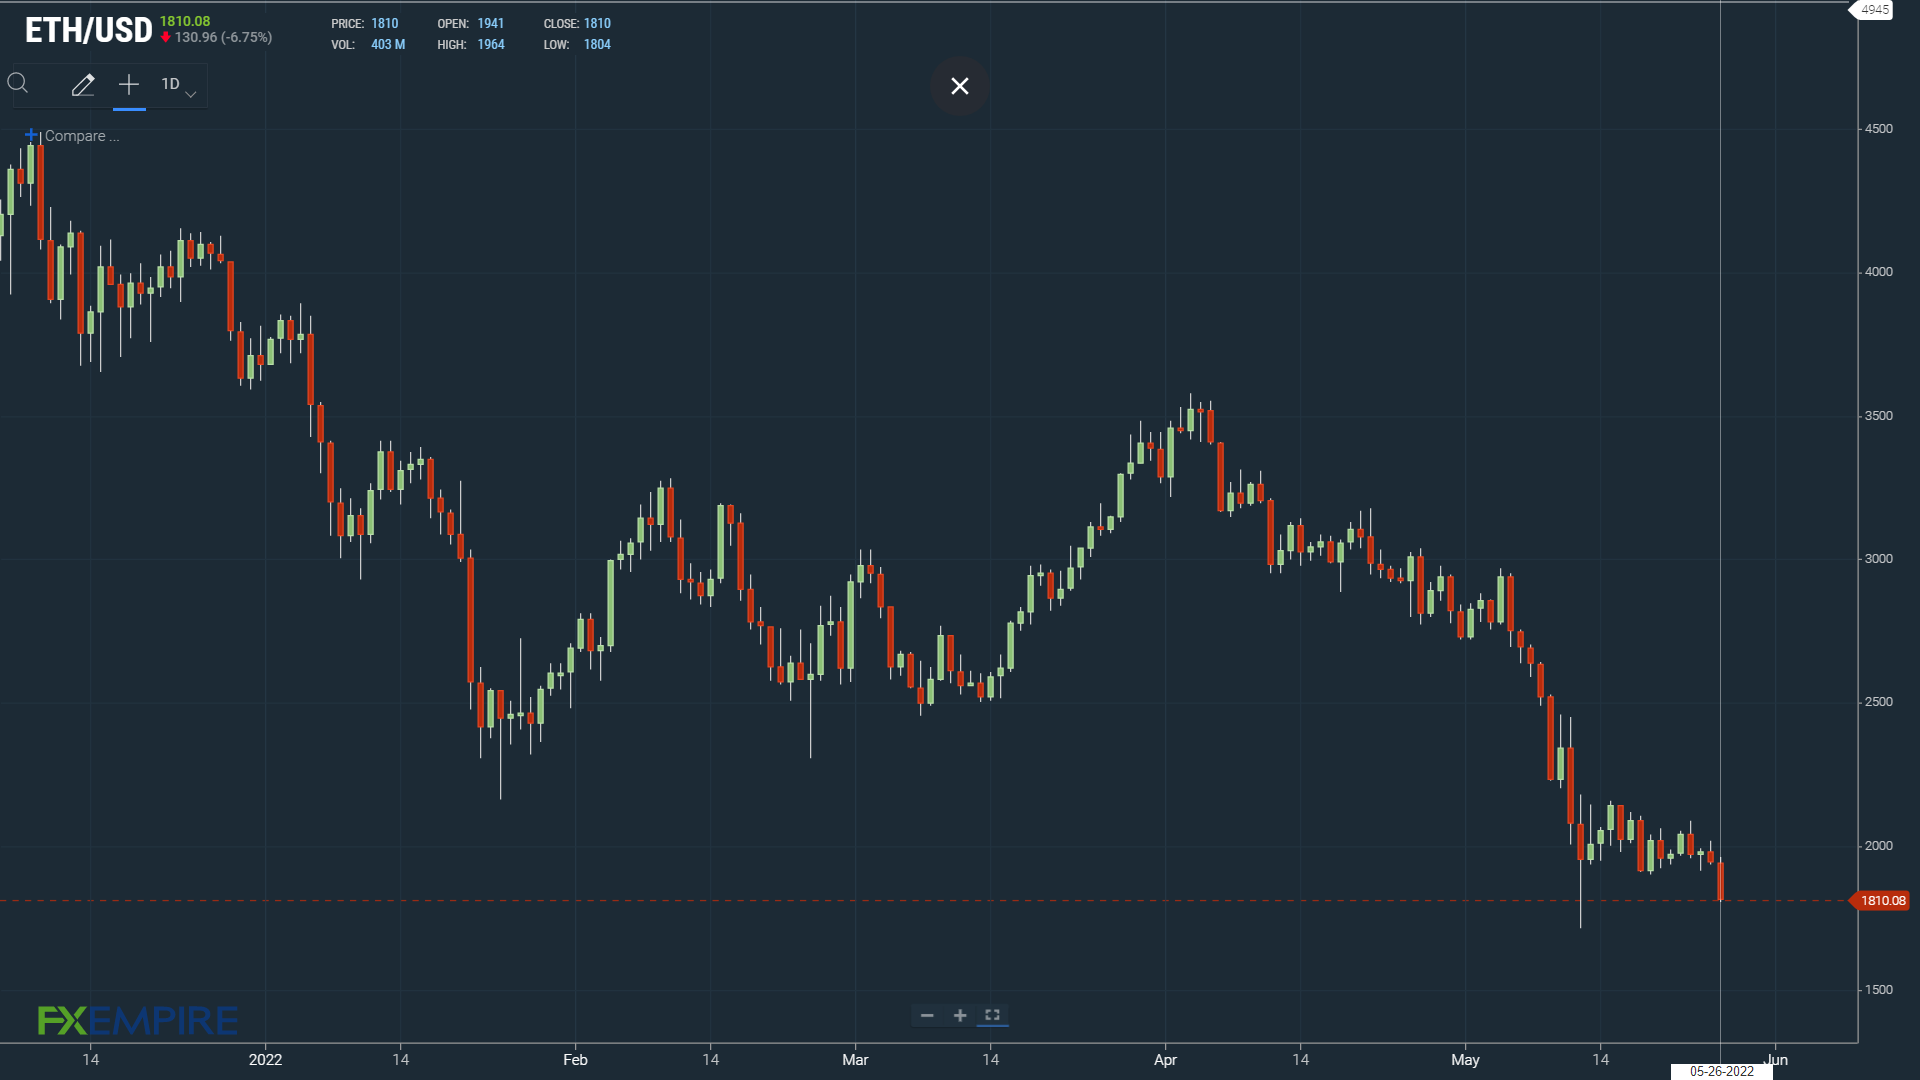
- It’s been a bearish morning, with Ethereum (ETH) tumbling by 6.75% to $1,810.
- A broad-based crypto sell-off saw ETH slide through Major Support Levels to test support at $1,800.
- Technical indicators are bearish, with ETH sitting below the 50-day.
On Wednesday, Ethereum (ETH) fell by 1.87%. Reversing a 0.36% decline from Tuesday, ETH ended the day at $1,941.
ETH tracked the broader market through the day to strike an early morning high of $2,020 before hitting reverse. The First Major Resistance Level at $2,009 pegged ETH back.
The reversal saw ETH slide to a day low of $1,933 before settling.
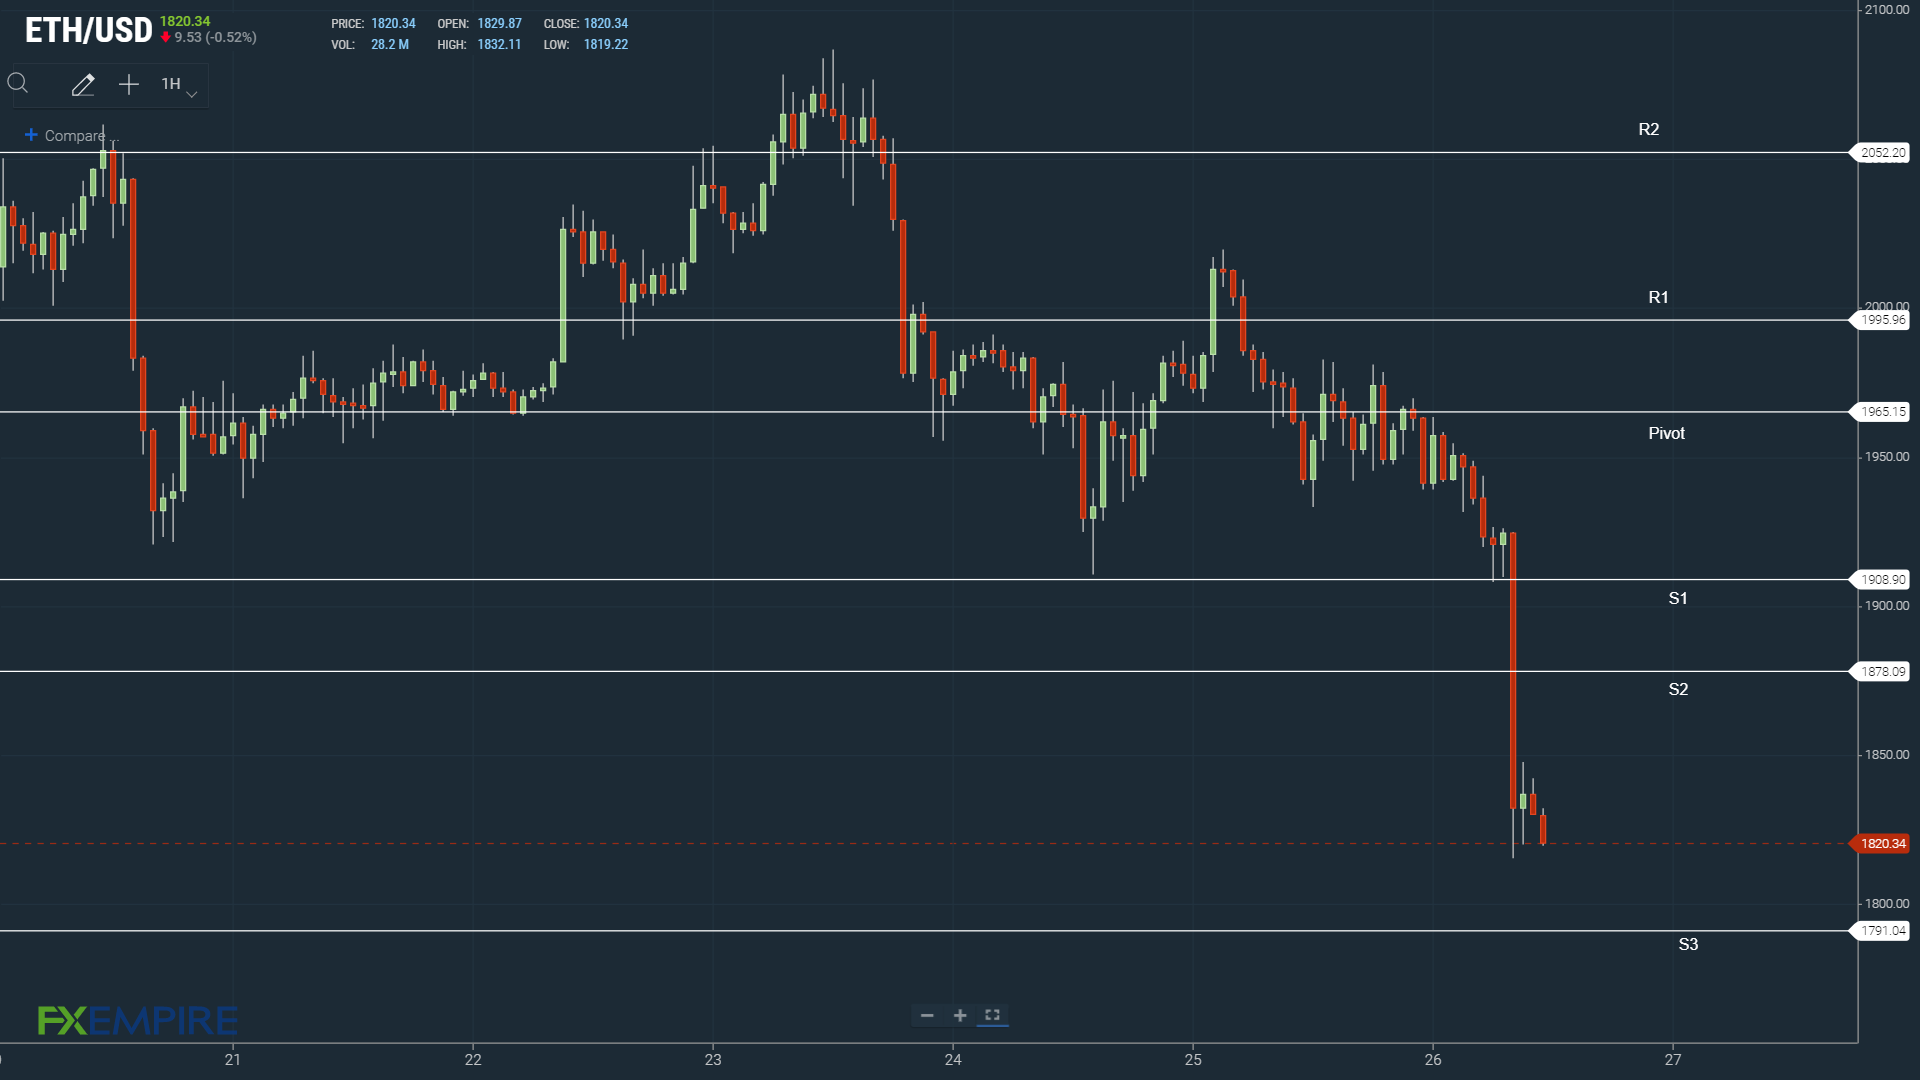
This morning, things were not much better, with ETH tumbling to a morning low of $1,804. The extended sell-off saw ETH fall through the First Major Support Level at $1,909 and the Second Major Support Level at $1,878.
Support at $1,800 limited the downside this morning.

Broad-Based Crypto Sell-Off Wipes Out Another $50 Billion
Bearish sentiment swept across the broader crypto market this morning, with the total crypto market cap falling to sub-$1,200 billion.
According to Coinglass, total liquidations came in at $294.55 million over the last 24 hours, with $195.49 million coming in the last 4-hours.
For Ethereum, total liquidations stood at $127.99 million over the last 24 hours and $103.65 million in the last 4-hours.
Technical Indicators
ETH will need to move through the Major Support Levels and the $1,965 pivot to target the First Major Resistance Level at $1,996.
Broader crypto market support would bring $1,900 levels back into play.
An extended rebound would test resistance at Wednesday’s high of $2,020 and the Second Major Resistance Level at $2,052. The Third Major Resistance Level sits at $2,139.
Failure to move through the Second Major Support Level at $1,878 would bring sub-$1,800 levels into play. Barring an extended sell-off, ETH should avoid sub-$1,750 and a current year low of $1,714. The Third Major Support Level at $1,791 should limit the downside.
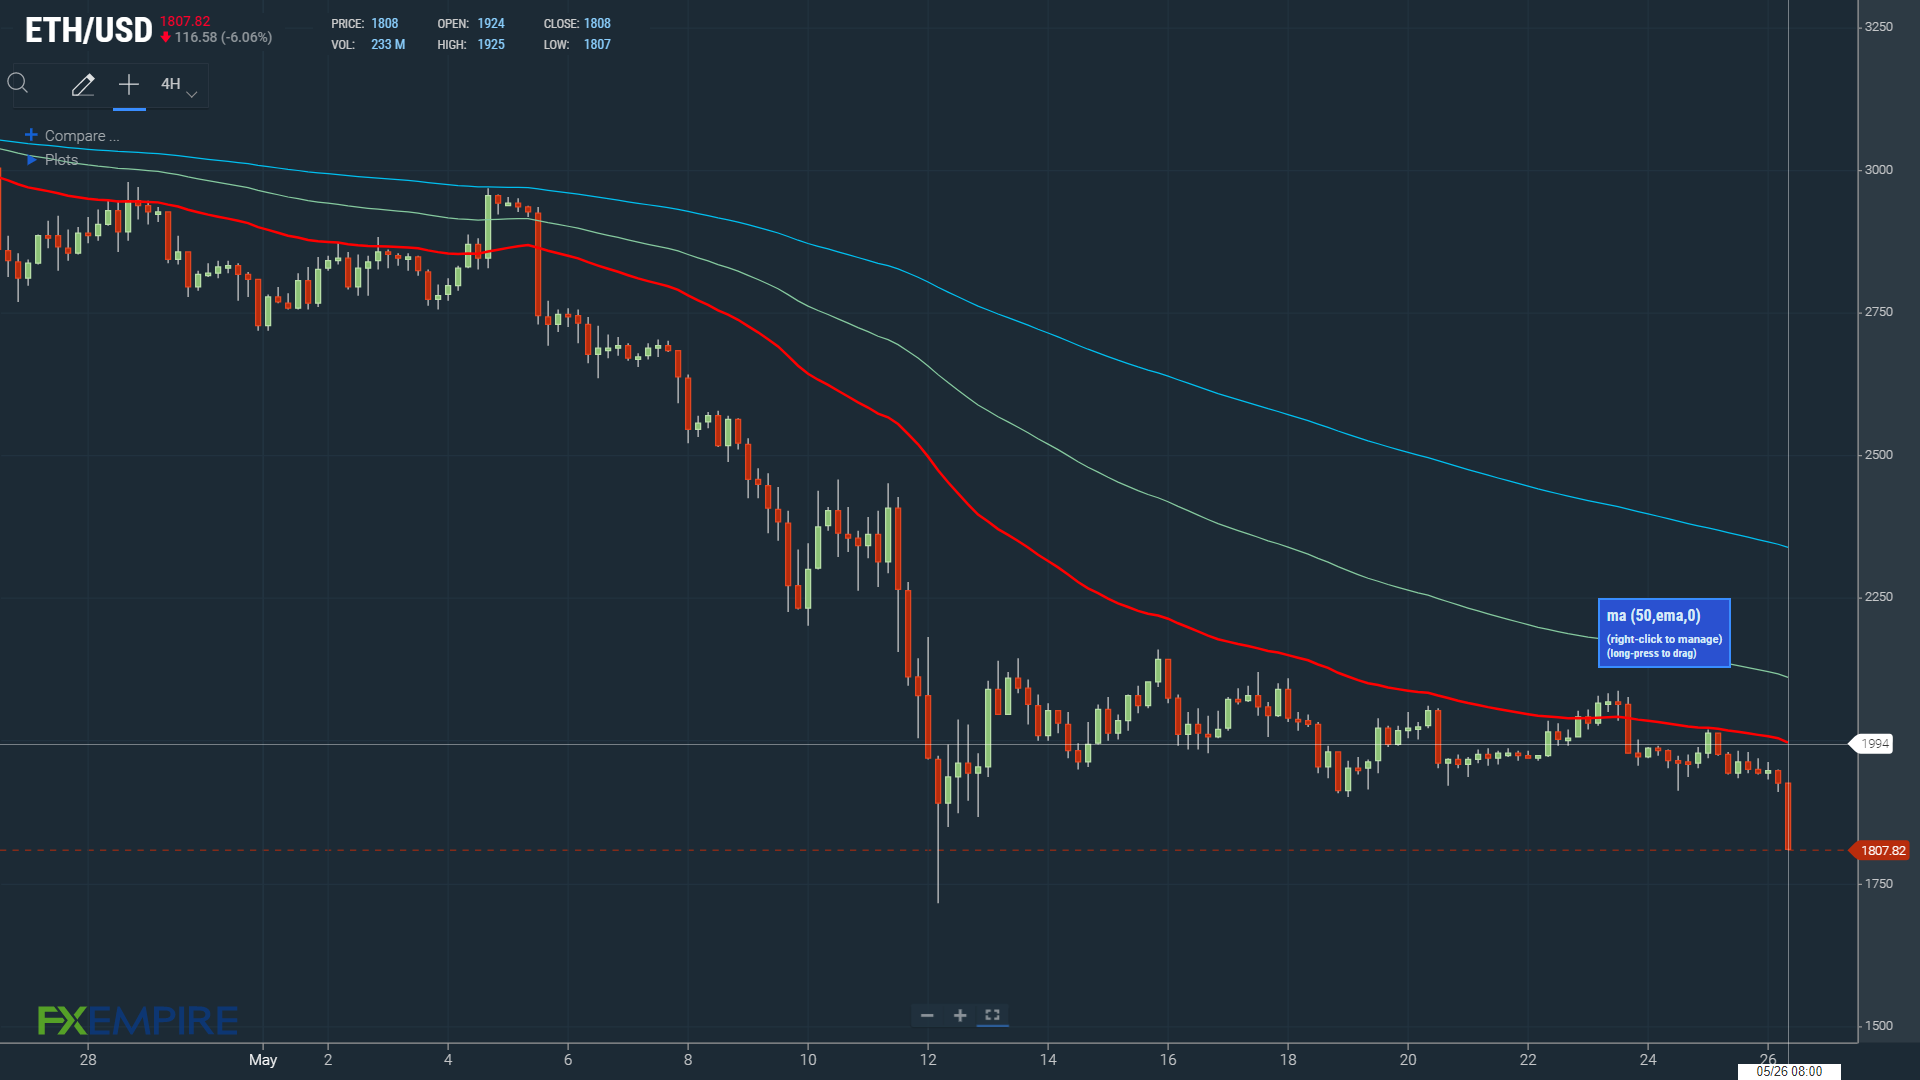
Looking at the EMAs and the 4-hourly candlestick chart (above), it is a bearish signal. ETH sits below the 50-day EMA, currently at $1,994. This morning, the 50-day EMA pulled back from the 100-day EMA. The 100-day EMA fell back from the 200-day EMA; price negative.
Failure to move through the 50-day EMA would bring sub-$1,800 into play.