
Advertisement
Advertisement
EUR/USD Mid-Session Technical Analysis for August 26, 2015
By:
Daily EUR/USD Technical Analysis The EUR/USD is trading lower at the mid-session. The current downside momentum suggests that sellers may have enough
Daily EUR/USD Technical Analysis
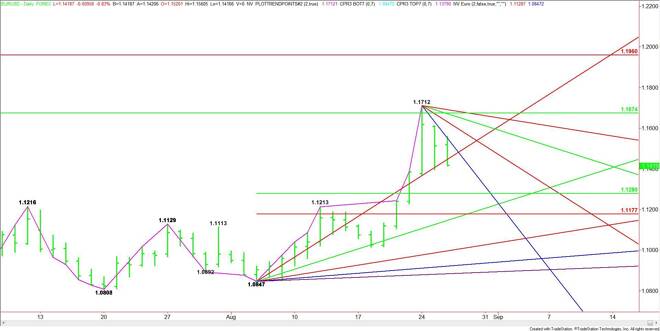
The EUR/USD is trading lower at the mid-session. The current downside momentum suggests that sellers may have enough power behind them to drive this market sharply lower over the next few days in a short-term retracement zone.
The main trend is up according to the daily swing chart. Earlier in the week, a rally stopped at 1.1712. This was slightly above a major 50% level at 1.1674.
Earlier today, the market found resistance on a downtrending angle at 1.1552. This will be resistance the remainder of the day along angles at 1.1632 and 1.1692.
On the downside, the EUR/USD is currently straddling a steep uptrending angle at 1.1447. This angle has given the market direction since the 1.0847 main bottom on August 5. Breaking it with conviction will shift the momentum to the downside.
The new short-term range is 1.0847 to 1.1712. A sustained move under 1.1447 could trigger a steep decline over the near-term into at least 1.1280. This is followed by a Fibonacci level at 1.1177.
The direction of the market today will be determined by trader reaction to 1.1447. A sustained move over it could trigger a rebound rally back to 1.1552. A sustained move under it opens up the Euro to a possible steep break.
2-Hour EUR/USD Technical Analysis
The main trend is up according to the 2-Hour Swing chart, but the lower top at 1.1561 suggests that momentum is shifting to the downside. A trade through 1.1396 will turn the main trend to down.
The intermediate range is 1.1240 to 1.1712. Its retracement zone is 1.1476 to 1.1420. The market is currently straddling its Fibonacci level at 1.1420. A sustained move under this level will put the market in a weak position.
The first downside target under 1.1420 is the main bottom at 1.1396. This is followed by a major 50% level at 1.1365 and a major Fibonacci level at 1.1283.
Holding 1.1420 and sustaining the move will signal the presence of buyers. The first upside objective is a 50% level at 1.1476. This is followed by a short-term 50% level at 1.1554, a main top at 1.1561 and a short-term Fibonacci level at 1.1591.
A sustained move over 1.1591 could trigger an acceleration to the upside with the next target 1.1712.
The direction of the market into the close today is likely to be determined by trader reaction to the Fibonacci level at 1.1420. Look for a bullish tone to develop on a sustained move over 1.1420 and a bearish tone to develop on a sustained move under 1.1420.
About the Author
James Hyerczykauthor
James Hyerczyk is a U.S. based seasoned technical analyst and educator with over 40 years of experience in market analysis and trading, specializing in chart patterns and price movement. He is the author of two books on technical analysis and has a background in both futures and stock markets.


Advertisement