
Advertisement
Advertisement
EUR/USD Mid-Session Technical Analysis for August 3, 2015
By:
Daily EUR/USD Technical Analysis The EUR/USD is trading lower at the mid-session. Volume has been below average and the price action lackluster. The main
Daily EUR/USD Technical Analysis
The EUR/USD is trading lower at the mid-session. Volume has been below average and the price action lackluster.
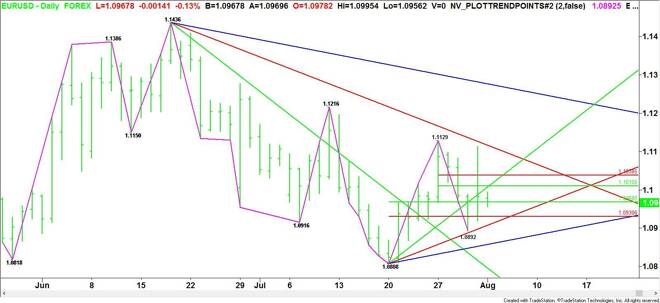
The main trend is down according to the daily swing chart. The main range is 1.0808 to 1.1129. Its retracement zone at 1.0969 to 1.0931 stopped the selling last week and is currently providing support.
The new short-term range is 1.1129 to 1.0892. Its retracement zone at 1.1010 to 1.1038 is a potential upside target today.
From the bottom up, support lines up like this. There is an uptrending angle at 1.0908, a Fibonacci level at 1.0930 and a 50% level at 1.0969.
Based on the current price at 1.0969, the first upside target is an uptrending angle at 1.1008. This is followed by a 50% level at 1.1010 and a Fibonacci level at 1.1038.
The current price action suggests that the direction of the EUR/USD the rest of the session will be determined by trader reaction to 1.0969. Treat this price like a pivot. Read your keys and try to avoid getting chopped up on both side of this price.
2-Hour EUR/USD Technical Analysis
The main trend is up on the 2-Hour chart, but momentum is to the downside.
The main range is 1.0893 to 1.1113. Its retracement zone is 1.1003 to 1.0977. After straddling the lower or Fibonacci level at 1.0977 for several hours, the EUR/USD continued its break. This level is new resistance.
Taking out the minor bottom at 1.0956 with conviction could trigger an acceleration to the downside with 1.0920 the next likely target.
Overcoming 1.0977 will signal the presence of buyers. This may generate enough upside momentum to trigger a move into 1.1003. This price is also a potential trigger point of an upside breakout with the next targets another retracement zone at 1.1035 to 1.1053.
Based on the current price at 1.0969, the direction of the market into the close according to the 2-Hour chart will be determined by trader reaction to 1.0977.
About the Author
James Hyerczykauthor
James Hyerczyk is a U.S. based seasoned technical analyst and educator with over 40 years of experience in market analysis and trading, specializing in chart patterns and price movement. He is the author of two books on technical analysis and has a background in both futures and stock markets.


Advertisement