
Advertisement
Advertisement
EUR/USD Mid-Session Technical Analysis for November 20, 2015
By:
Daily EUR/USD Technical Analysis The EUR/USD is trading lower at the mid-session. The market is posting an inside range and straddling a retracement zone.
Daily EUR/USD Technical Analysis
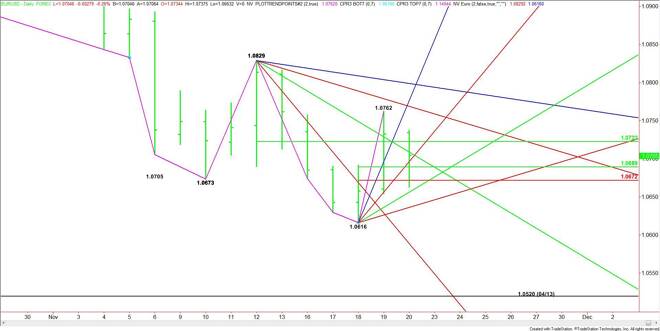
The EUR/USD is trading lower at the mid-session. The market is posting an inside range and straddling a retracement zone. This indicates trader indecision and impending volatility. The longer it stays in a range, the greater the breakout.
The main trend is down according to the daily swing chart.
The main range is 1.0829 to 1.0616. Its 50% level is 1.0722. The market traded on both sides of this level on Thursday and earlier today. This suggests a range bound market.
The short-term range is 1.0616 to 1.0762. Its retracement zone is 1.0689 to 1.0672. This zone was straddled earlier today also and provided support. This is another sign of trader indecision.
The testing of the two 50% levels suggests a developing stalemate between the buyers and the sellers.
In addition to the retracement levels the EUR/USD is locked between a pair of Gann angles. On the downside, uptrending angles come in at 1.0656 and 1.0636. On the upside, the angles come in at 1.0696 and 1.0709.
The current price action suggests the market will trade sideways with 1.0672 support and 1.0722 resistance. This type of formation typically indicates that traders are waiting for news before making their next move.
2-Hour EUR/USD Technical Analysis
The main trend is up according to the 2-Hour EUR/USD swing chart. However, momentum has been to the downside since the formation of the closing price reversal top at 1.0762.
Like the daily chart, the 2-Hour chart indicates the EUR/USD is range bound.
The main range is 1.0829 to 1.0616. Its retracement zone is 1.0722 to 1.0748. This zone is currently acting like resistance.
The short-term range is 1.0616 to 1.0762. Its retracement zone at 1.0689 to 1.0672 is providing support.
Based on the current price at 1.0698 and the volume and volatility, it looks as if the market is going to spend the session inside a pair of 50% levels at 1.0689 and 1.0722.
If volatility returns then treat 1.0748 and 1.0672 as possible trigger points for price accelerations.
About the Author
James Hyerczykauthor
James Hyerczyk is a U.S. based seasoned technical analyst and educator with over 40 years of experience in market analysis and trading, specializing in chart patterns and price movement. He is the author of two books on technical analysis and has a background in both futures and stock markets.


Advertisement