
Advertisement
Advertisement
EUR/USD Mid-Session Technical Analysis for October 28, 2014
By:
Daily EUR/USD Technical Analysis Trading is light in the EUR/USD market this morning. Many traders are on the sidelines ahead of Wednesday’s U.S. Federal
Daily EUR/USD Technical Analysis
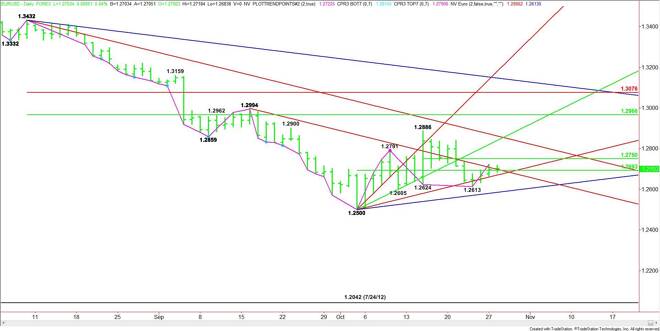
Trading is light in the EUR/USD market this morning. Many traders are on the sidelines ahead of Wednesday’s U.S. Federal Reserve Monetary Policy Statement and Friday’s Euro Zone consumer inflation report.
The main range is 1.2500 to 1.2886. The pivot created by this range at 1.2693 is controlling the short-term direction of the market.
The first support angle under the pivot is 1.2670. Breaking this angle could trigger a break into the last main bottom at 1.2613. Taking out this bottom will reaffirm the downtrend. This could lead to a break into the next support angle at 1.2585.
Holding above the downtrending angle at 1.2694 will be the first sign of strength, however, the best indication of the presence of buyers will be holding above the pivot at 1.2693.
The short-term range is 1.2886 to 1.2613. Its pivot at 1.2750 is the next likely upside target. The daily chart opens up over this level with a potential upside target at 1.2862.
Hourly EUR/USD Technical Analysis
The main trend is up on the hourly chart. The last main bottom is 1.2665. A trade through this price will turn the main trend to down.
The main range is 1.2839 to 1.2613. The 50% price formed by this range at 1.2726 is currently the best resistance. This price is controlling the short-term direction of the market.
The intermediate range is 1.2613 to 1.27225. Its retracement zone at 1.2668 to 1.2655 is a potential downside target and possible support zone. The market must hold a break into this zone to continue with its higher-bottom, higher-top formation. If 1.2655 fails then look for an acceleration to the downside.
The short-term range is 1.2665 to 1.27225. Its retracement zone at 1.2694 to 1.2687 is currently being tested. Trader reaction to this zone should set the tone the rest of the session. Holding 1.2694 will mean that buyers may come in later today to challenge 1.27225 to 1.2726. A failure at 1.2687 could lead to an acceleration to the downside with 1.2668 to 1.2665 the minimum downside target.
Try to avoid getting caught in a choppy market between 1.2694 and 1.2687.
About the Author
James Hyerczykauthor
James Hyerczyk is a U.S. based seasoned technical analyst and educator with over 40 years of experience in market analysis and trading, specializing in chart patterns and price movement. He is the author of two books on technical analysis and has a background in both futures and stock markets.


Advertisement