Advertisement
Advertisement
GBP/USD Daily Forecast – Sterling on Pace to Post a Fifth Consecutive Day of Gains
By:
GBP/USD marched higher in the early day, trading at levels not seen since early May. The pair is coming into a bit of resistance although the upward momentum remains strong.
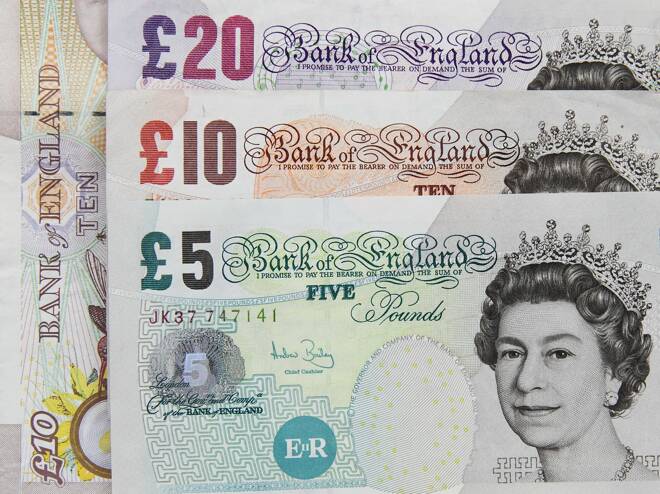
GBP/USD Breaks to Fresh Seven-Month High
GBP/USD made a technical break on Tuesday and has been rallying with momentum since. The pair is benefiting from a weaker dollar, but more importantly, investors appear to be pricing in a Tories victory.
Sterling is the second strongest currency among the majors, falling behind only the New Zealand dollar. The pound to dollar exchange rate is up 1.85% for the week thus far.
A report by the ADP yesterday showed the jobs market expanding at a smaller rate than expected. 67,000 new jobs were reported in November versus an expected 137,000. The data set a softer tone for Friday’s NFP jobs report although not by much.
Analysts had been looking for 189,000 new jobs in the NFP report on Friday but have revised down expectations to 186,000. Nevertheless, the data should trigger volatility in the FX market.
Market participants will also be paying attention to shifts in expectations for the outcome of next week’s election. Last week, the Tories lead narrowed but GBP/USD managed to breakout despite this news. This leads me to believe the hurdle for a turn in the exchange rate is a large one.
Technical Analysis
But even though it might take a major catalyst to shift the momentum in GBP/USD, I do see some resistance coming into play.
The level I have my eye on falls at 1.3145. On a weekly chart, this level was responsible for keeping the pair lower in the second half of 2018, when looking at price on a daily close basis. Further, it was also an important level in the first week of May when the pair gapped lower to open near the price point which ultimately marked the start of a four-month downtrend.
In addition to the horizontal level, some moving averages have come into play on a weekly chart. Namely the 100 and 200-period moving averages. Currently, the pair has crossed above both, but the weekly close in relation to them will be important.
To put things in perspective, the last time GBP/USD posted a weekly close above the 200-week moving average was five years ago.
Bottom Line
- GBP/USD continues to show strong upward momentum.
- Some resistance has come into play but there has not been enough price action at this stage to suggest selling pressure from the level.
About the Author
Jignesh Davdaauthor
Jignesh has 8 years of expirience in the markets, he provides his analysis as well as trade suggestions to money managers and often consults banks and veteran traders on his view of the market.
Advertisement
