The GBP/USD pair initially tried to rally during the week but turned right back around to form a negative candle. It appears that we are going to continue
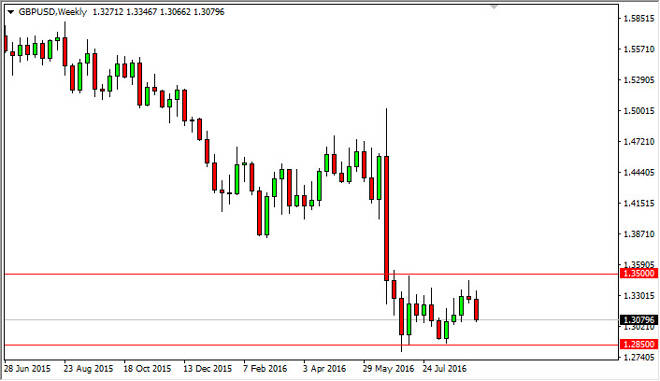
The GBP/USD pair initially tried to rally during the week but turned right back around to form a negative candle. It appears that we are going to continue to see some type of consolidation between the 1.35 level above, and the 1.2850 level on the bottom. Now that the volume is starting to pick up after the summer break, I believe that the market is eventually going to break down and reach towards the 1.25 handle. Ultimately, I believe that rallies will continue to be selling opportunities on signs of exhaustion again and again.
Chris is a proprietary trader with more than 20 years of experience across various markets, including currencies, indices and commodities. As a senior analyst at FXEmpire since the website’s early days, he offers readers advanced market perspectives to navigate today’s financial landscape with confidence.