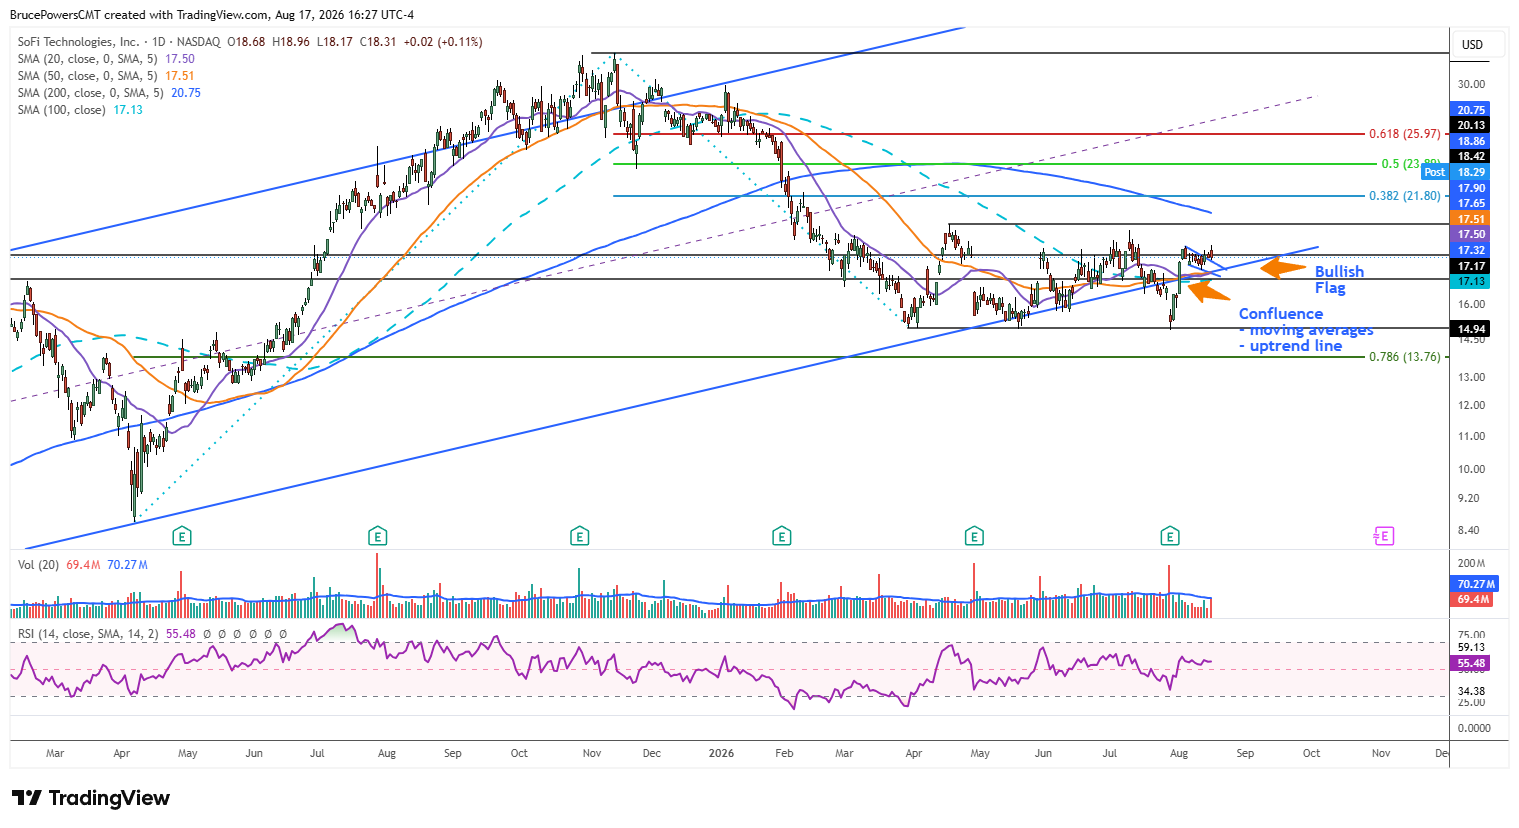
SoFi Technologies, Inc. (SOFI) stock initially declined following its Q2 2026 earnings report before the market opened on July 29. That led to a large gap down and decline to test a key support zone, reaching a low of $14.88 before support was seen. Support had previously been seen near the low of a five-month range near $14.92. The slight undercut of the prior low after earnings, followed by a daily bullish reversal signal the next day and continued strength, suggest that what is now a six-month consolidation range may be getting closer to an upside breakout and the completion a bearish correction that followed the $32.73 peak in November. SoFi Technologies operates a digital financial services platform, offering lending, financial services, and a technology platform.

Bullish Flag Builds Momentum
Subsequently, key potential resistance levels were recovered during the continued advance, including a long-term term uptrend line and major moving averages, including the 20-day, 50-day, and 100-day moving averages. Following a high of $18.86, SOFI pulled back and formed a bullish flag continuation pattern that triggered last week. Then, a new trend high of $18.96 was reached on Monday, further confirming the breakout of the flag. Although the initial breakout signals occurred above the upper boundary line of the flag pattern, a daily close above the $18.86 high is still needed to confirm.
$20.13 Becomes Next Major Test
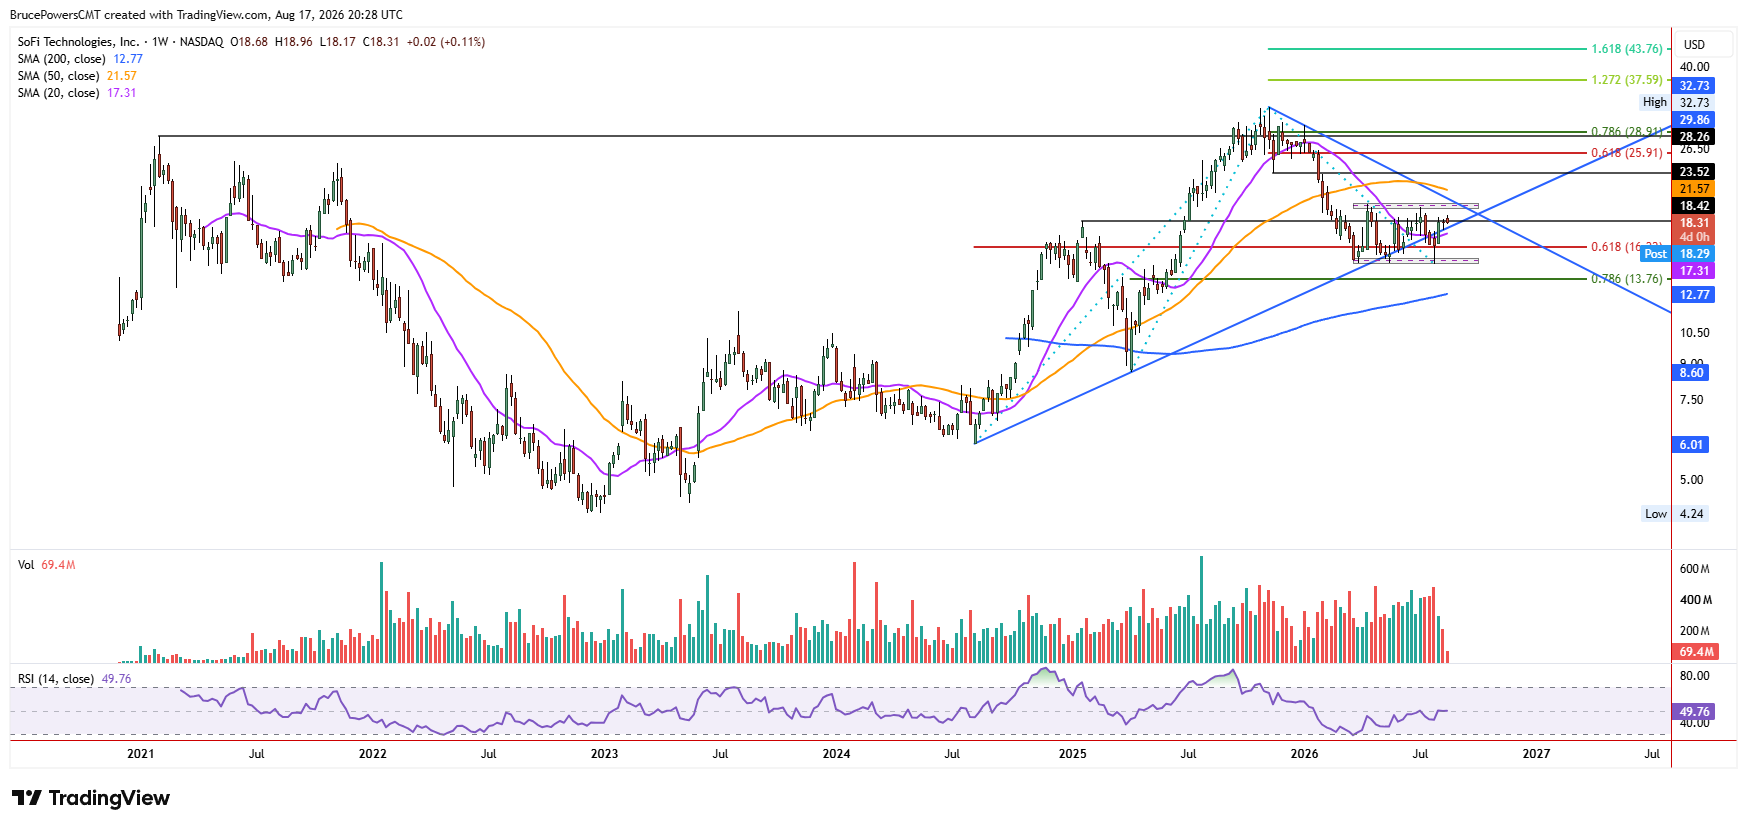
It remains to be seen whether the flag breakout can be sustained and lead to a possible breakout of the larger consolidation pattern, with a high of $20.13 from April. That price area will take on added potential significance, as the long-term 200-day moving average near $20.75 also represents a key initial resistance zone. Since it is falling, it will enhance potential resistance near the top of the multi-month range. A near-term bullish outlook may be maintained unless last week’s low of $17.65 is broken to the downside. That would also signal a failure of the flag pattern.
Larger Breakout Could End Correction
Overall, SOFI is indicating that it may be getting close to completing its bearish correction. A bullish reversal of a bottom consolidation range on a rally above $20.13 would signal a breakout of the range. That would put SOFI in a position to challenge higher resistance levels on the road to a recovery and a continuation of the larger bullish trend.