Long-Term Breakout Establishes Bullish Foundation
Analysis of Intel Corporation (INTC) begins with the long-term view on a monthly chart, as the larger pattern influences shorter timeframes and provides important context for recent price action. The pattern is bullish, showing a decisive upside breakout above the top of a long-term basing pattern in April, accompanied by increasing volume. This new bullish trend-continuation signal ultimately resulted in a new high for INTC at $142.35 in June, before leading to a retracement.

Support Retest Gives Way to Reversal
The basing pattern had a high of $75.18 that was reached in 2000, and it was successfully tested as support with the recent pullback, which resulted in a higher swing low of $81.79 in July. The switch from key resistance to support is bullish behavior, supported by the completion of an approximate 61.8% Fibonacci retracement at $79.49 before buyers regained control and price turned higher. This appears to have completed the first notable pullback following the long-term bullish breakout above key resistance.
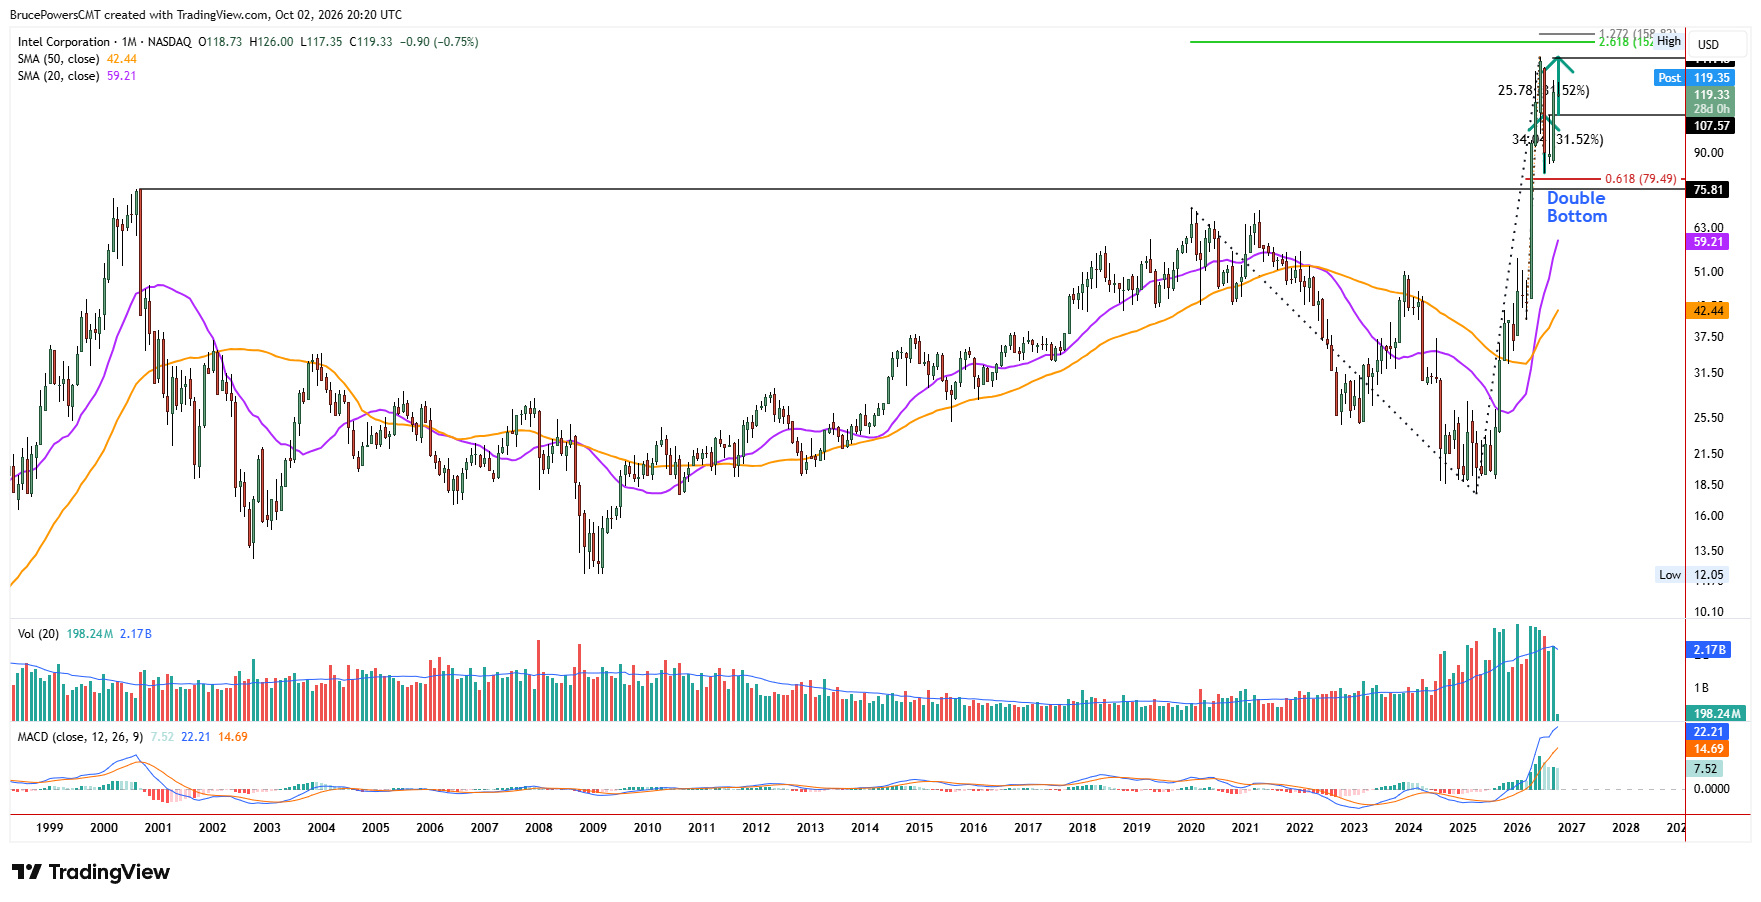
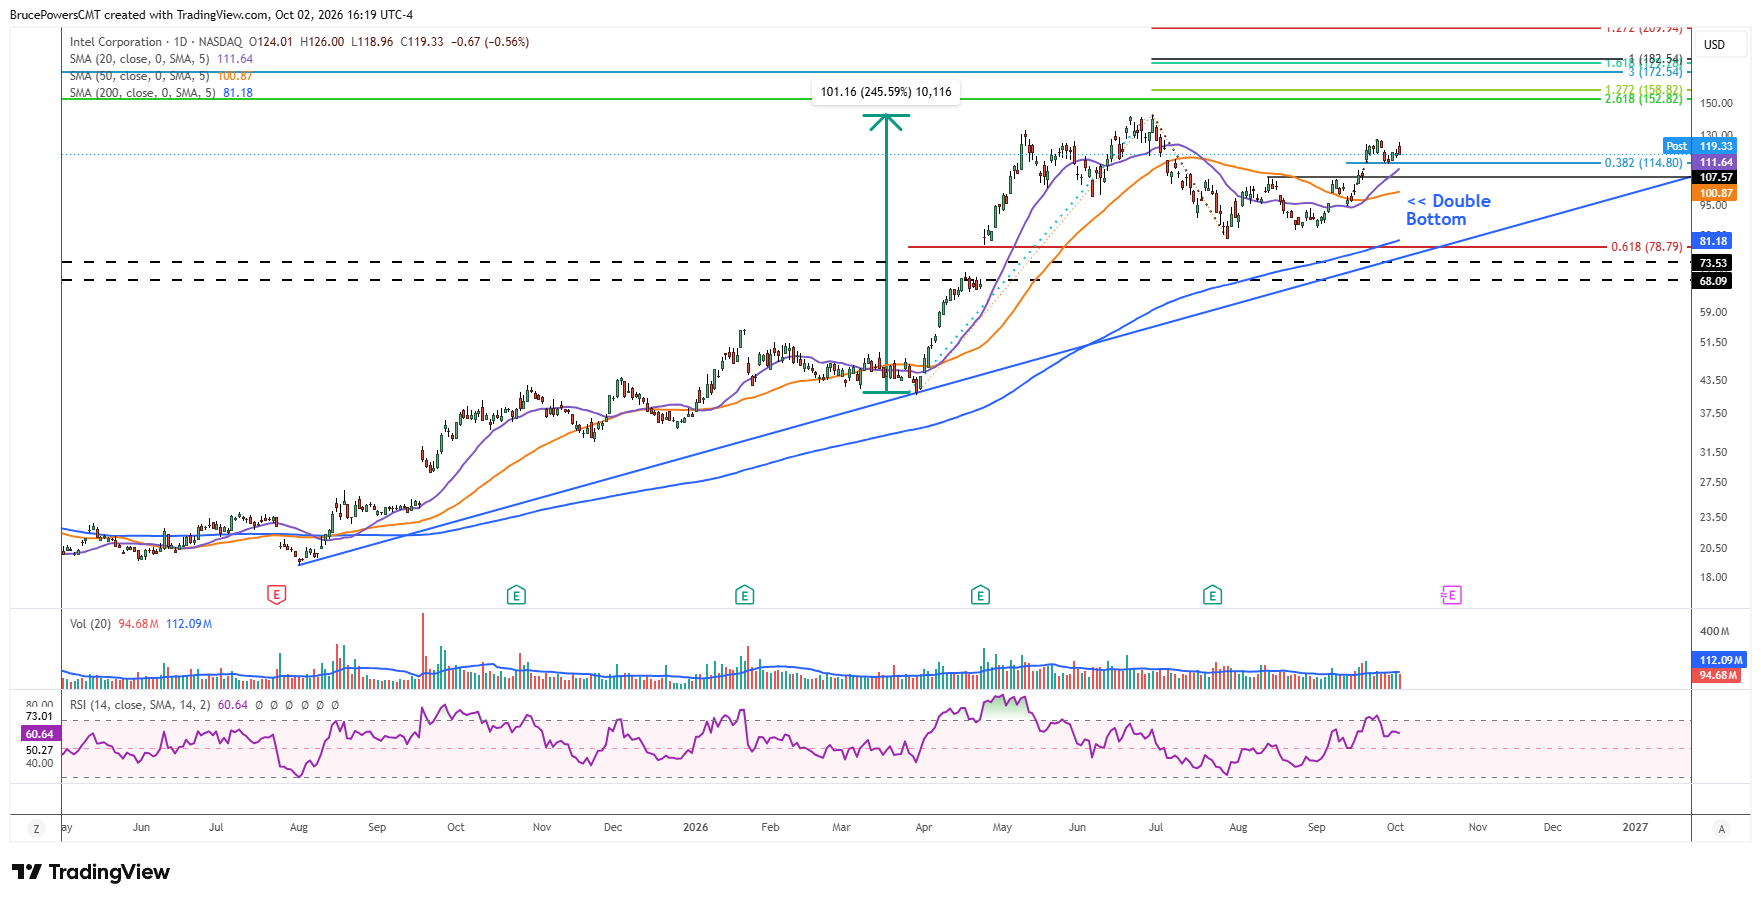
A double bottom pattern subsequently formed, and an upside breakout triggered a bullish reversal with an opening gap above the neckline at $107.57 last week. That area is now key support, along with the 20-week moving average near $108.10 currently.
However, the higher 20-day moving average near $111.55 provides an initial potential dynamic support zone during weakness. There is also potential support at this week’s higher swing low of $113.97. Since the gap remains unfilled and trading has continued near its upper boundary, it remains vulnerable to a test during any near-term weakness.
Fresh Breakout Could Extend Powerful Advance
Meanwhile, the new higher swing low is part of a growing bullish trend structure, with the next signal coming from a breakout above last week’s high of $127.44. The first upside target is this year’s high of $142.35. Above that level, there are a couple of initial resistance zones that present possible upside targets if buyers can retain control. Prior to the recent correction INTC had advanced by as much as 245% when measured from the March swing low to the June peak of $142.35.
That magnitude of prior strength highlights the potential for another decisive advance now that a new bullish structure has developed. The long-term breakout, successful retest of support, and subsequent double-bottom reversal together provide the broader technical foundation for a continued advance.
If you’d like to know more about technical analysis and how traders use it, please visit our educational area.