Bullish Reversal Emerges Above $3
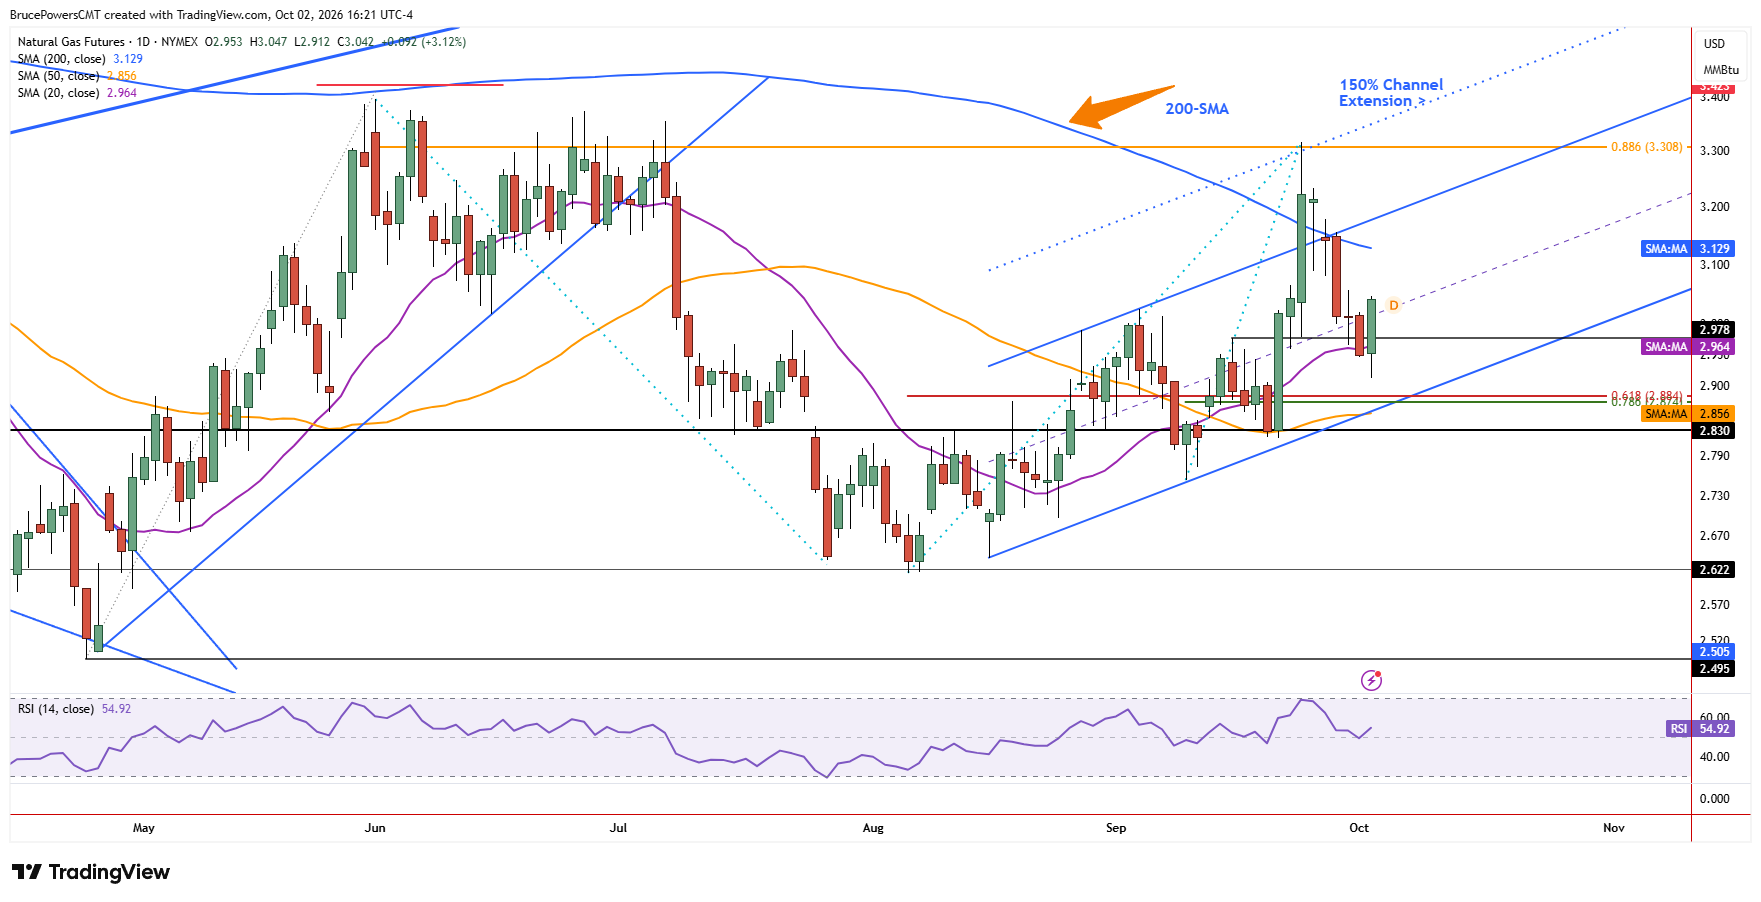
Natural gas staged a bullish outside day on Friday, signaling a potential shift in control from sellers to buyers within a single session. Earlier in the session, a new retracement low of $2.912 was reached before buyers took back control and pushed prices above Thursday’s high of $3.021. At the time of writing, trading continues near the high of the day at $3.028. A daily close above Thursday’s high will confirm the one-day bullish reversal signal and provide an early indication that the retracement may be ending.

Rebound Faces Resistance Ahead
Although further signs of strength are needed, the intraday switch of control from sellers to buyers suggests that a low for the retracement may have been reached. For now, the expectation is for a bounce into key resistance after that resistance area failed to hold as support recently. The 200-day moving average near $3.13 and falling is an initial upside target, followed by the lower daily high at $3.156 from Tuesday. If prior support is confirmed as resistance, downward pressure remains, while a reclaim of key levels would show improving demand and the potential for prices to rise further.
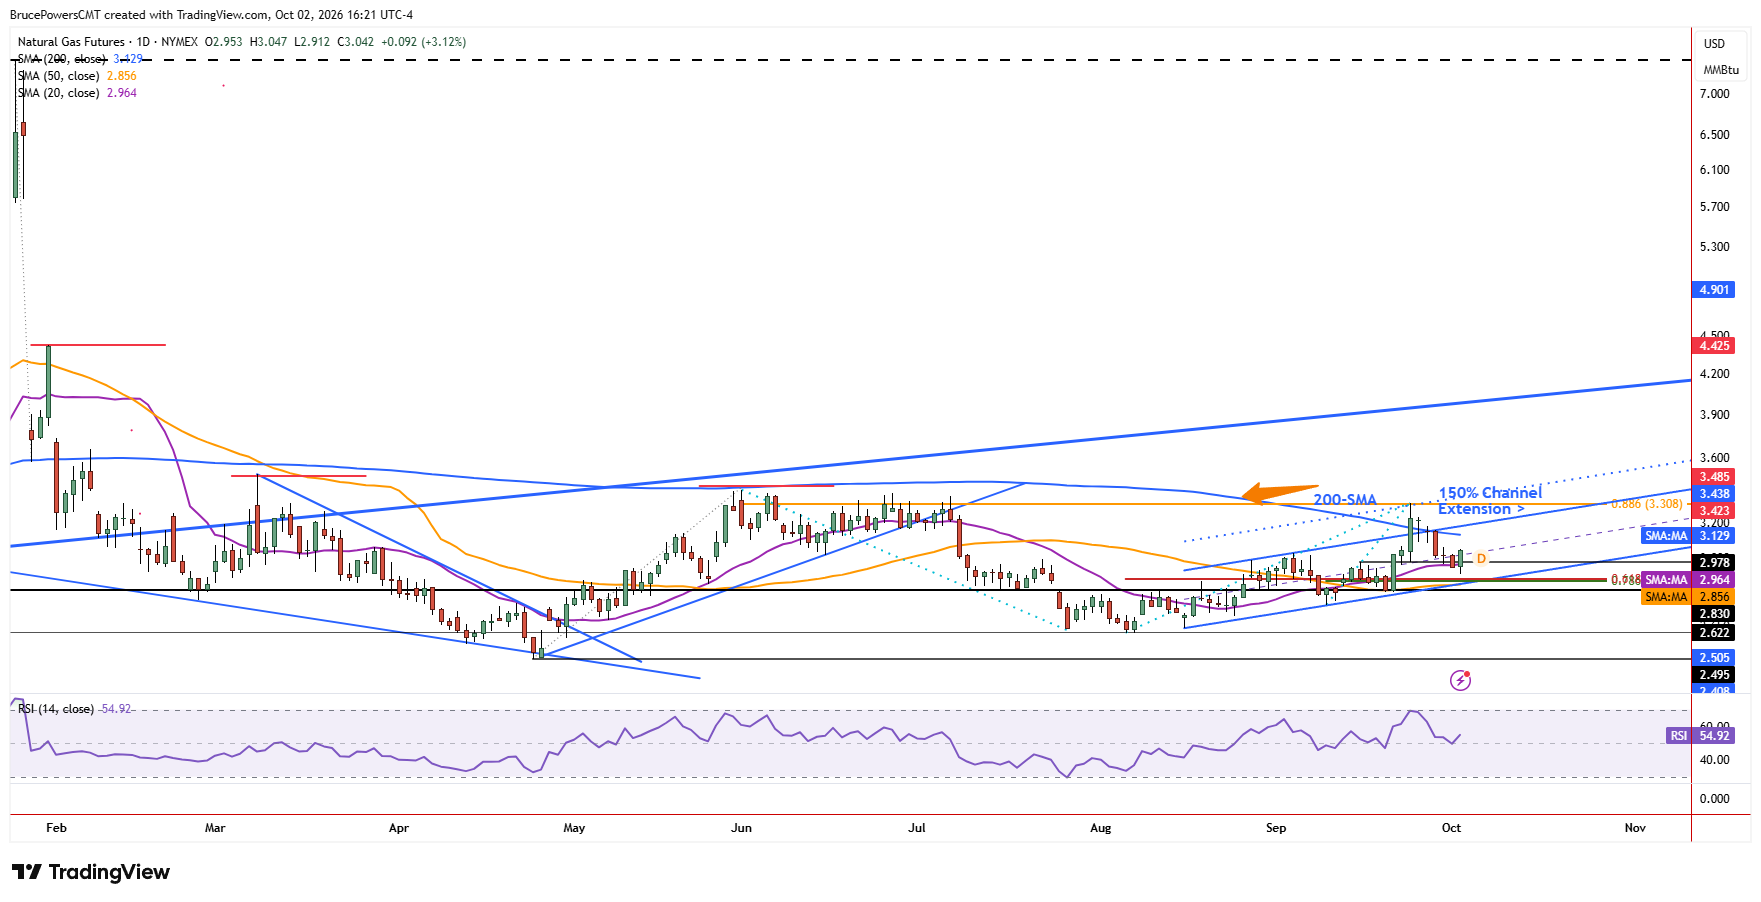
A failed reclaim of the 200-day moving average occurred during the recent advance to a high of $3.317, so if it again switches to marking resistance, another leg down from the recent high would remain possible. However, Friday’s recovery also reclaimed the 20-day moving average, which is increasing in significance as dynamic support for the short-term trend. A sustained hold above that moving average would provide additional evidence of improving short-term momentum, while a subsequent break below it would weaken that bullish reversal signal.
Weekly Support Strengthens Reversal Case
The weekly chart shows this week’s range contained within last week’s range, reflecting consolidation on that timeframe. It also provides key support and resistance levels, at $2.912 and $3.18, respectively. Another important development is that this week is set to close above support represented by the 200-week moving average near $2.997 and the 20-week moving average around $2.985.
Both failed to hold as support earlier in the week, but quick reclaims within the week show that support has been retained near those moving averages. Therefore, Friday’s bullish outside day is occurring as natural gas remains above important weekly support, giving the short-term reversal signal a stronger technical foundation.
Natural Gas Price Forecast
Every new Natural Gas analysis as it publishes, today's technical signal and key levels, live price — on one page.
See all Natural Gas forecastsIf you’d like to know more about how to trade natural gas, please visit our educational area.