Resistance Test Fails to Shift Momentum
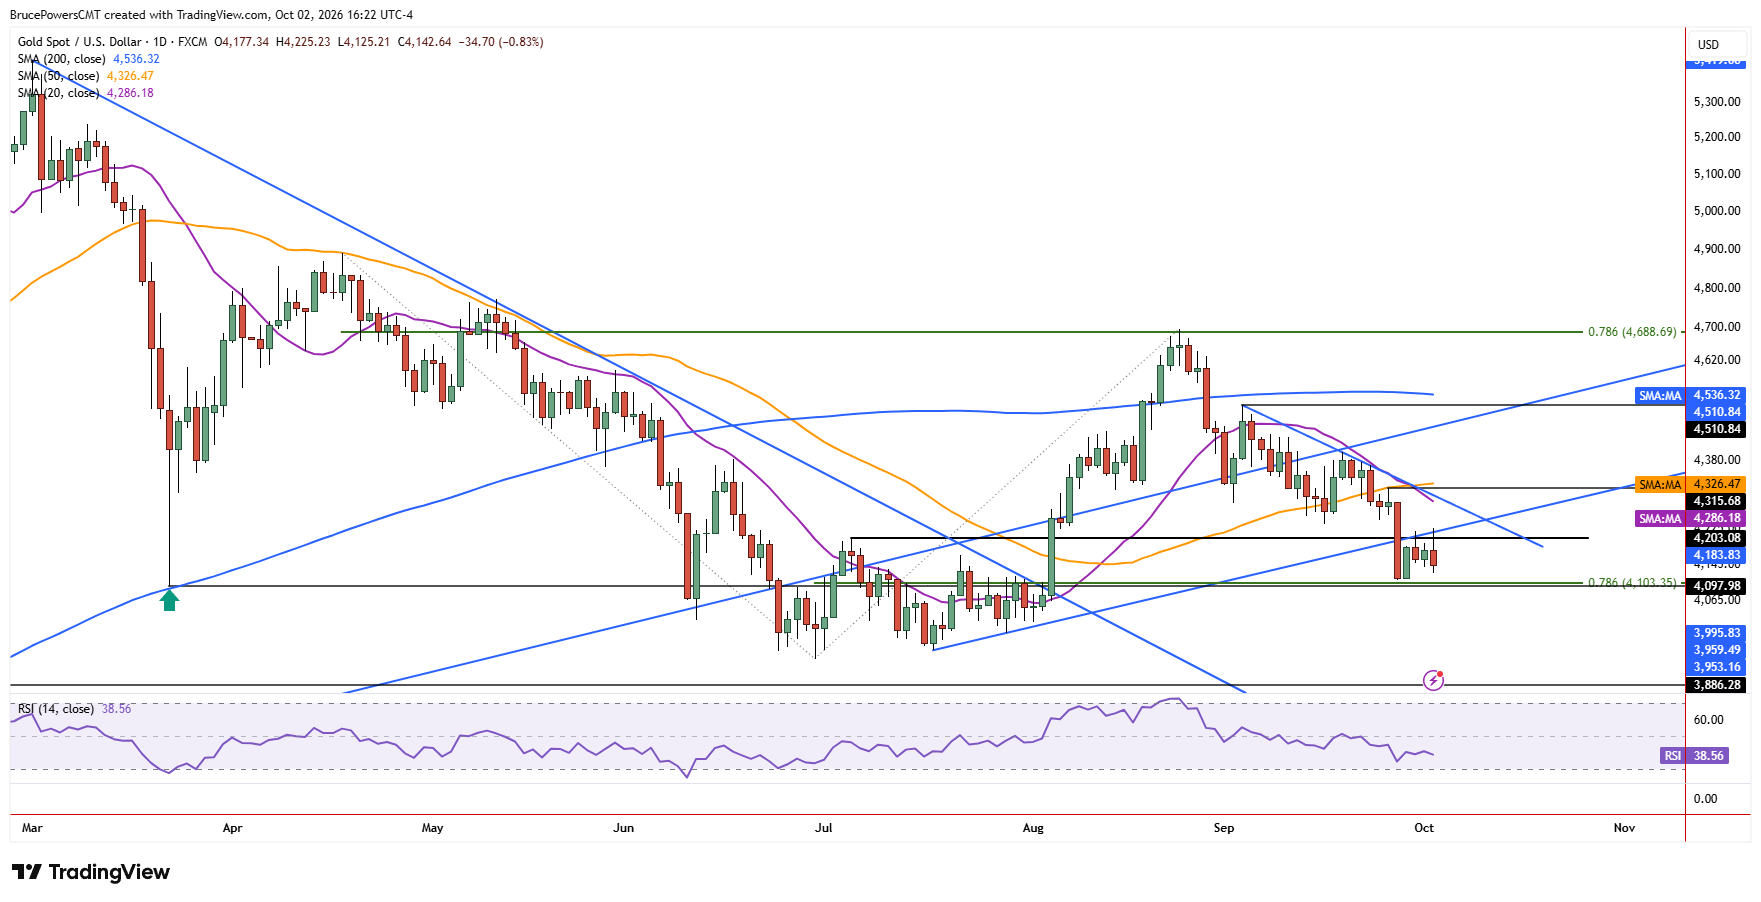
Gold remained caught between competing forces on Friday, trading outside of the range from the prior two days. A close below Thursday’s low of $4,139 would reinforce the bearish implications from price action and suggest that the bearish correction in gold is not complete. The high of the day at $4,225 was a four-day high and marked a second recent test of resistance near the confluence of the uptrend line and the lower swing high of $4,203 from July. The failure to break above that resistance is bearish behavior, further supported by Friday’s weak close in the lower third of the week’s range.

Sellers Strengthen Their Grip Below Resistance
This week’s bearish price action and weak weekly close show sellers dominating price action, leaving the trend vulnerable to further downside. Whether that happens before or after a bounce remains to be seen. With the bearish implications from Monday’s breakdown and trend extension now reinforced, further evidence of sellers regaining control is emerging. A break below Thursday’s low would provide another short-term bearish signal and increase the likelihood of a test of lower support.
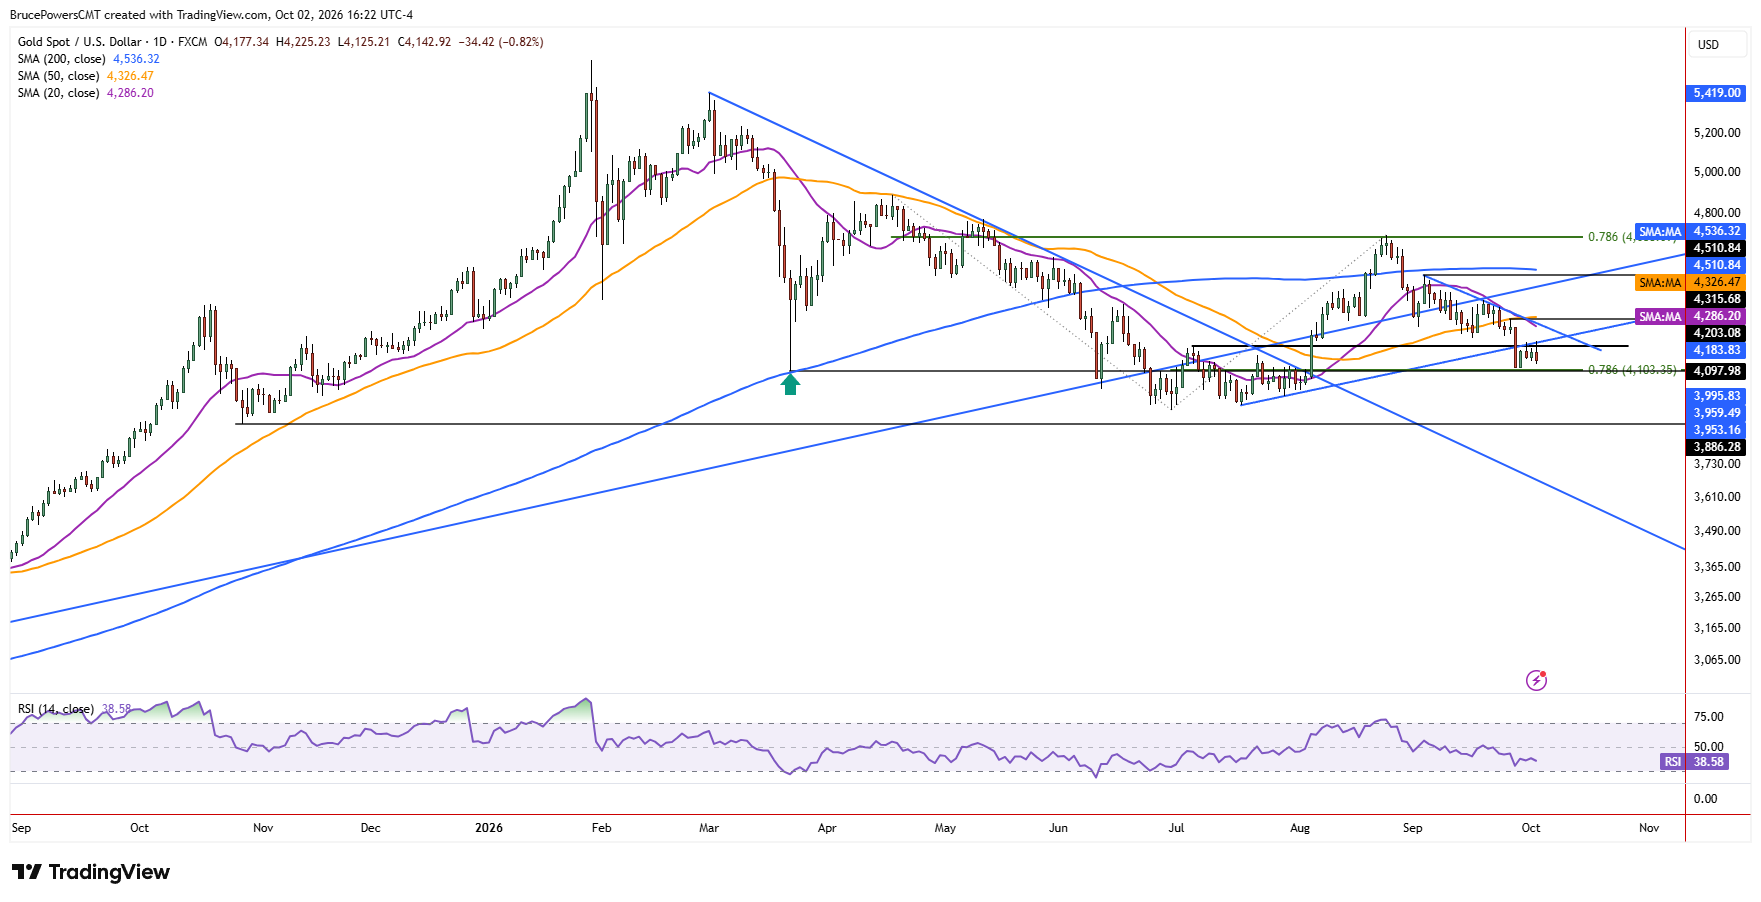
So far, support near the 78.6% Fibonacci retracement of the prior advance has held with the week’s low of $4,111. If that zone breaks with a decisive decline below the Fibonacci level at $4,103, the June low of $3,942 may eventually be challenged, along with support from the higher swing low of $3,886 from October 2025. A decline below the June low would signal a continuation of the bearish trend structure as support at the prior low would be broken. Until then, the $4,103-$4,111 zone remains an important test for sellers.
$4,103 Becomes Next Bearish Trigger
Despite the bearish implications of this week’s price action, support has held at $4,111, leaving open the possibility that a decisive rally above Friday’s high could lead to a test of resistance near the falling 20-day moving average near $4,285, which is also close to the week’s high of $4,285, or a minor lower swing high at $4,316. The downtrend prevails unless there is a recovery of the lower swing high and the 50-day moving average, currently near $4,326. Therefore, Friday’s failed push above resistance keeps the bearish structure intact, while a break below $4,103 would provide the next confirmation that the correction is extending lower.
If you’d like to know more about how to trade gold and silver, please visit our educational area.