



USOIL: U.S. Inventories Tighten as Middle East Risks Cloud Supply Outlook
Tightening U.S. crude and refined products fundamentals and recent geopolitical risks have dominated the oil market. According to the latest EIA report, crude oil inventories rose only marginally in the week ended September 25, and distillate inventories fell by 2.3 million barrels. Refinery utilization fell to 92.5%. The draw in middle distillates is more significant because the availability of diesel has been strained following the disruptions at Middle East and Russian refineries.
The U.S. is also attempting to enlist the support of its European allies to release emergency diesel reserves, while there have been discussions about placing restrictions on U.S. diesel exports. Given the supply risks on other parts of the world, the U.S. is exposed to disruptions, and if headline crude inventories are showing some comfort, the U.S. energy complex could see disruptions.

UKOil: Global Fuel-Supply Stress Deepens After China Export Halt
Brent fundamentals improved with the halt of oil product exports from China (Hong Kong and Macau) as refiners focused on domestic markets. This removed another important supply source from an already constrained international market. Disruptions at Gulf and Russian refineries have left product supplies tighter than crude.
Geopolitical risks have increased with reporting of a build-up of the US military in the Middle East. OPEC+ is expected to leave November production targets unchanged when they meet on Sunday. There are still a number of members of OPEC+ operating below their production quota due to regional disruptions.
Natural Gas: Storage Cushion Shrinks as LNG Demand Remains Strong
Working natural gas in storage in the US rose by 64 Bcf last week to 3,415 Bcf. This is 2.4% above the five year average and 3.9% below last year.
The surplus to the five year average has been decreasing as we approach the end of the injection season.
Natural Gas Price Forecast
Every new Natural Gas analysis as it publishes, today's technical signal and key levels, live price — on one page.
See all Natural Gas forecastsUS LNG exports rose to 10.9 million metric tons in September. Nearly 5.7 million metric tons of LNG was exported to Europe to help customers refill their stores for the winter. Demand for feed gas has helped to offset high natural gas production and declining demand in the US for natural gas.
Natural Gas Technical Analysis: NG Breaks $2.95 Support as $2.86 Becomes the Next Downside Test
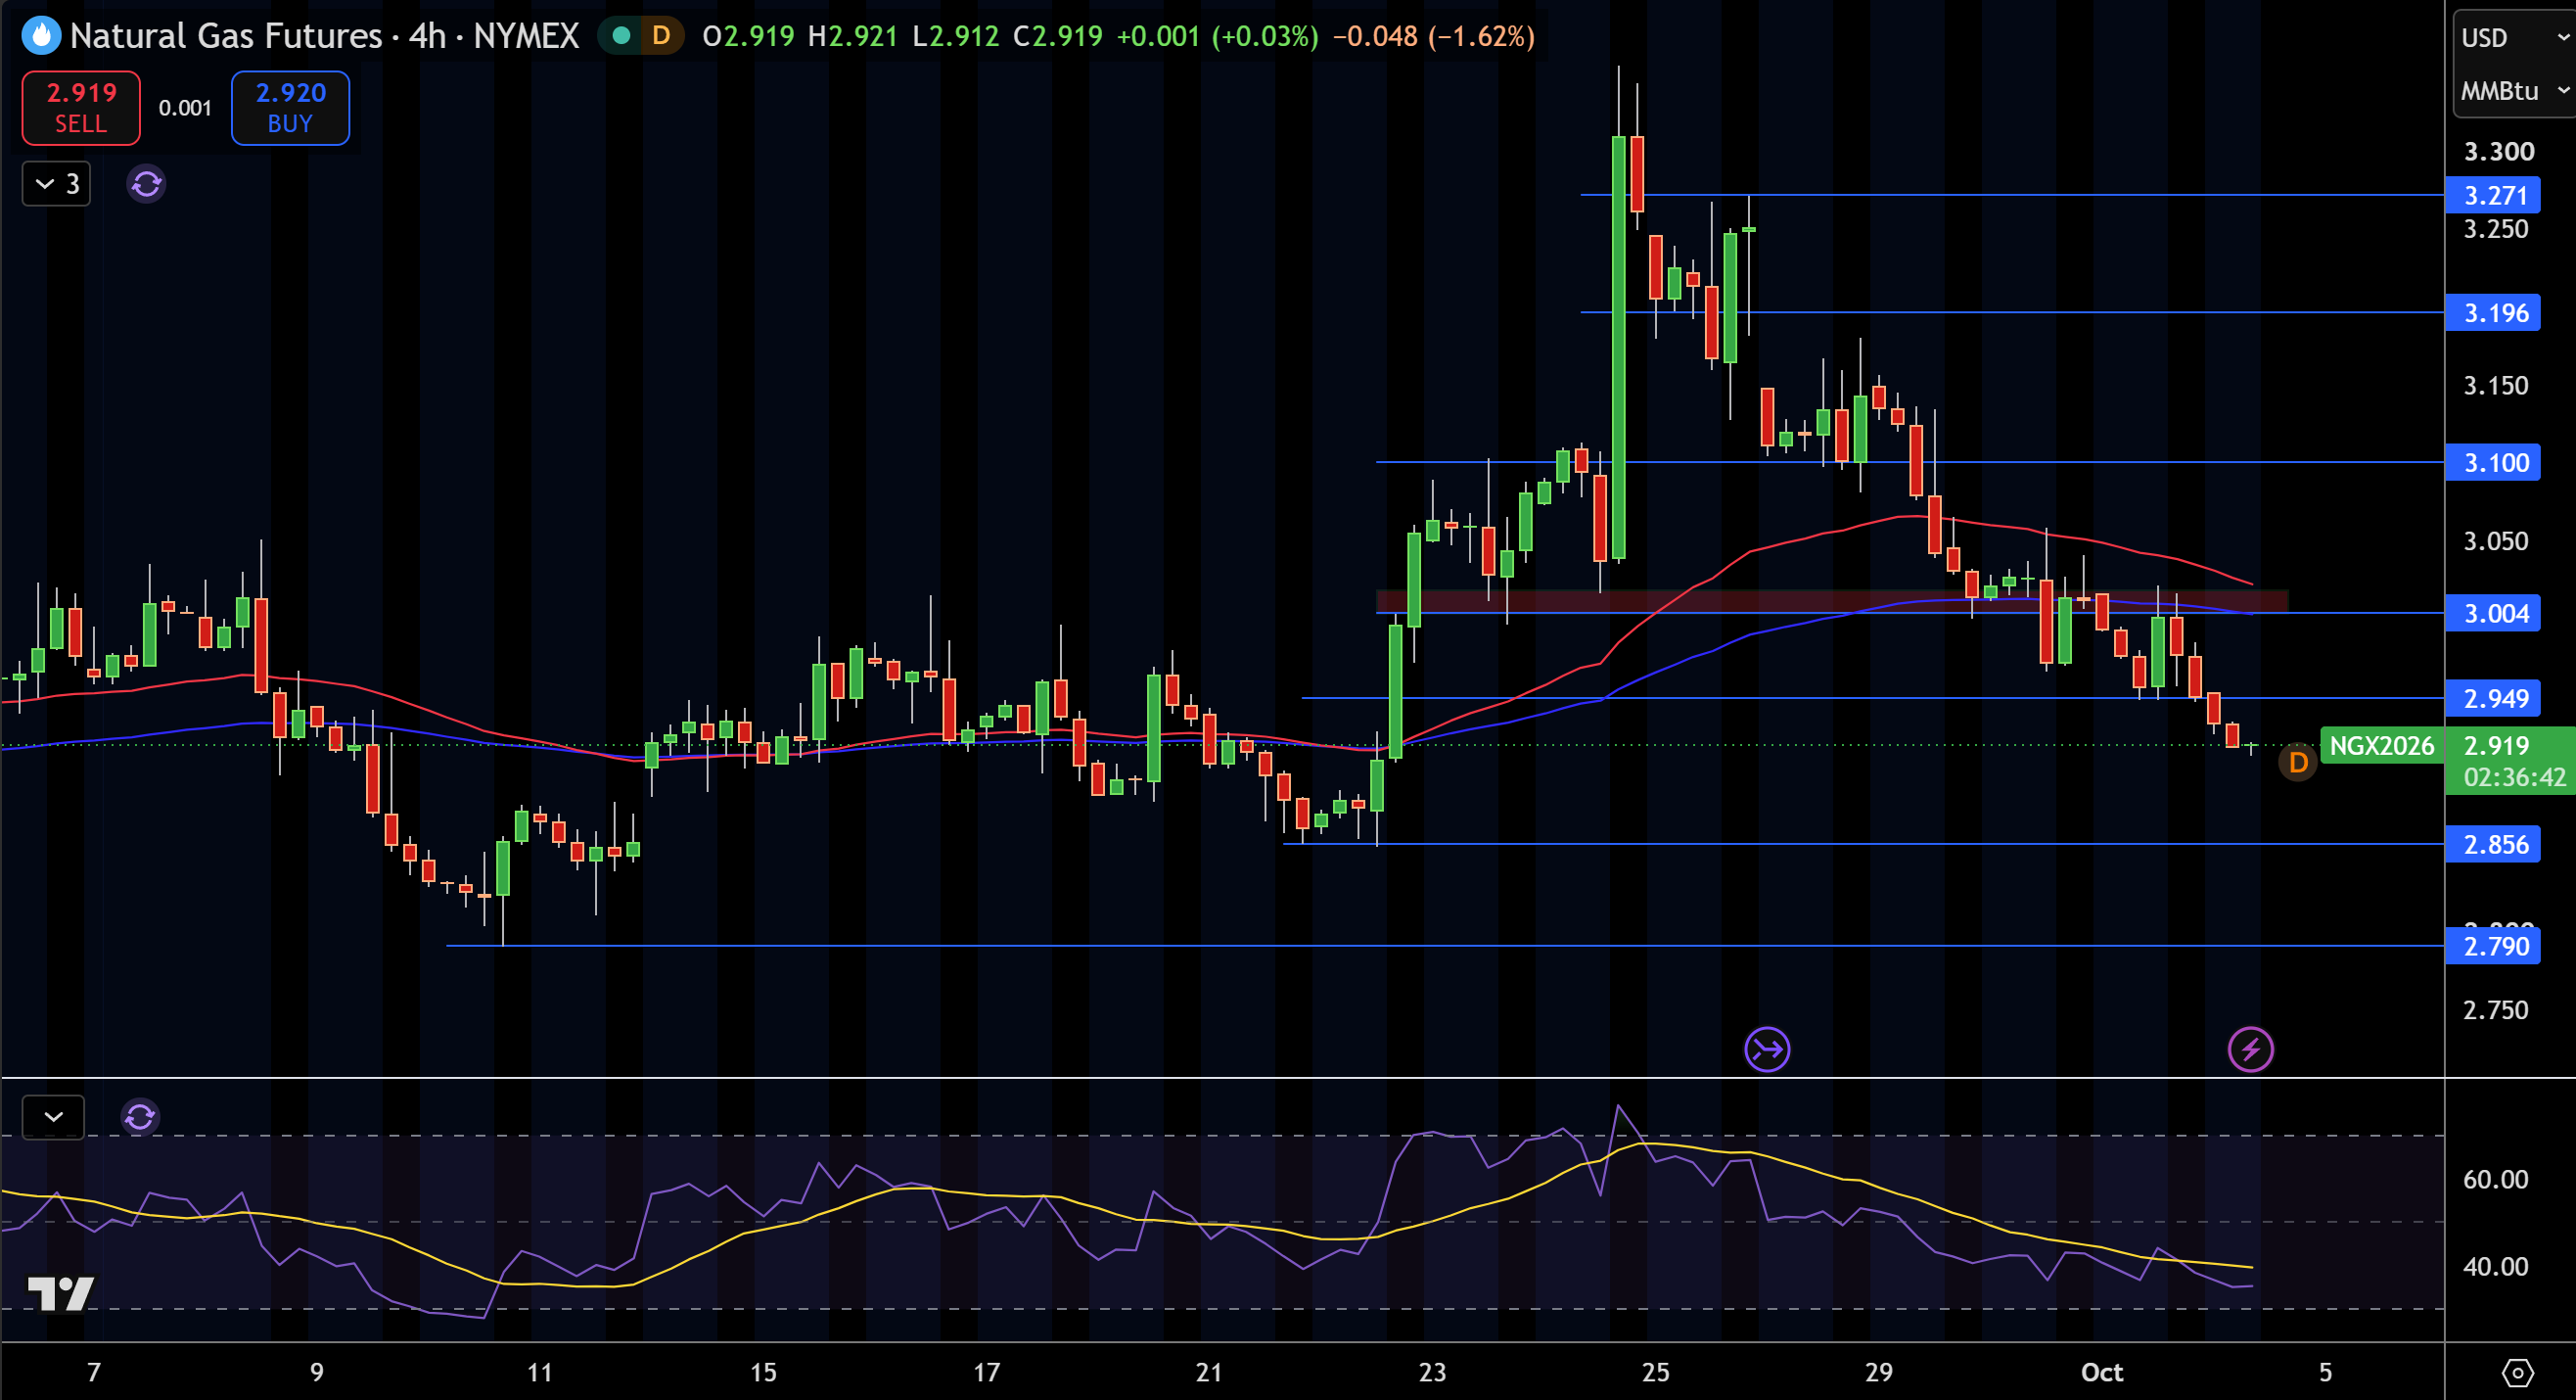
Natural gas is trading at $2.92 on the 4 hour chart, moving below the $2.95 support and remaining under the 200 and 50 SMA. The continuous series of lower highs and lower lows since the rejection of the $3.27 area continues to put pressure on the broader short term trend.
The first support I am looking at is $2.86. A break below this level opens up $2.79. The 50 SMA is at $2.96, and the 200 SMA is at $3.06, so $3.00 becomes the next resistance, along with $3.10 and $3.20.
RSI is in the lower range and is sloping down, indicating downward momentum. This indicates that I should remain bearish on natural gas as long as it remains trading below $2.95 and $3.00. A trade above $3.10 would change my overall view bearish. A break below $2.86 would confirm the case for $2.79.
WTI Crude Oil Technical Analysis: USOIL Rebounds From $88.54 as $92.90 Remains the Key Recovery Test
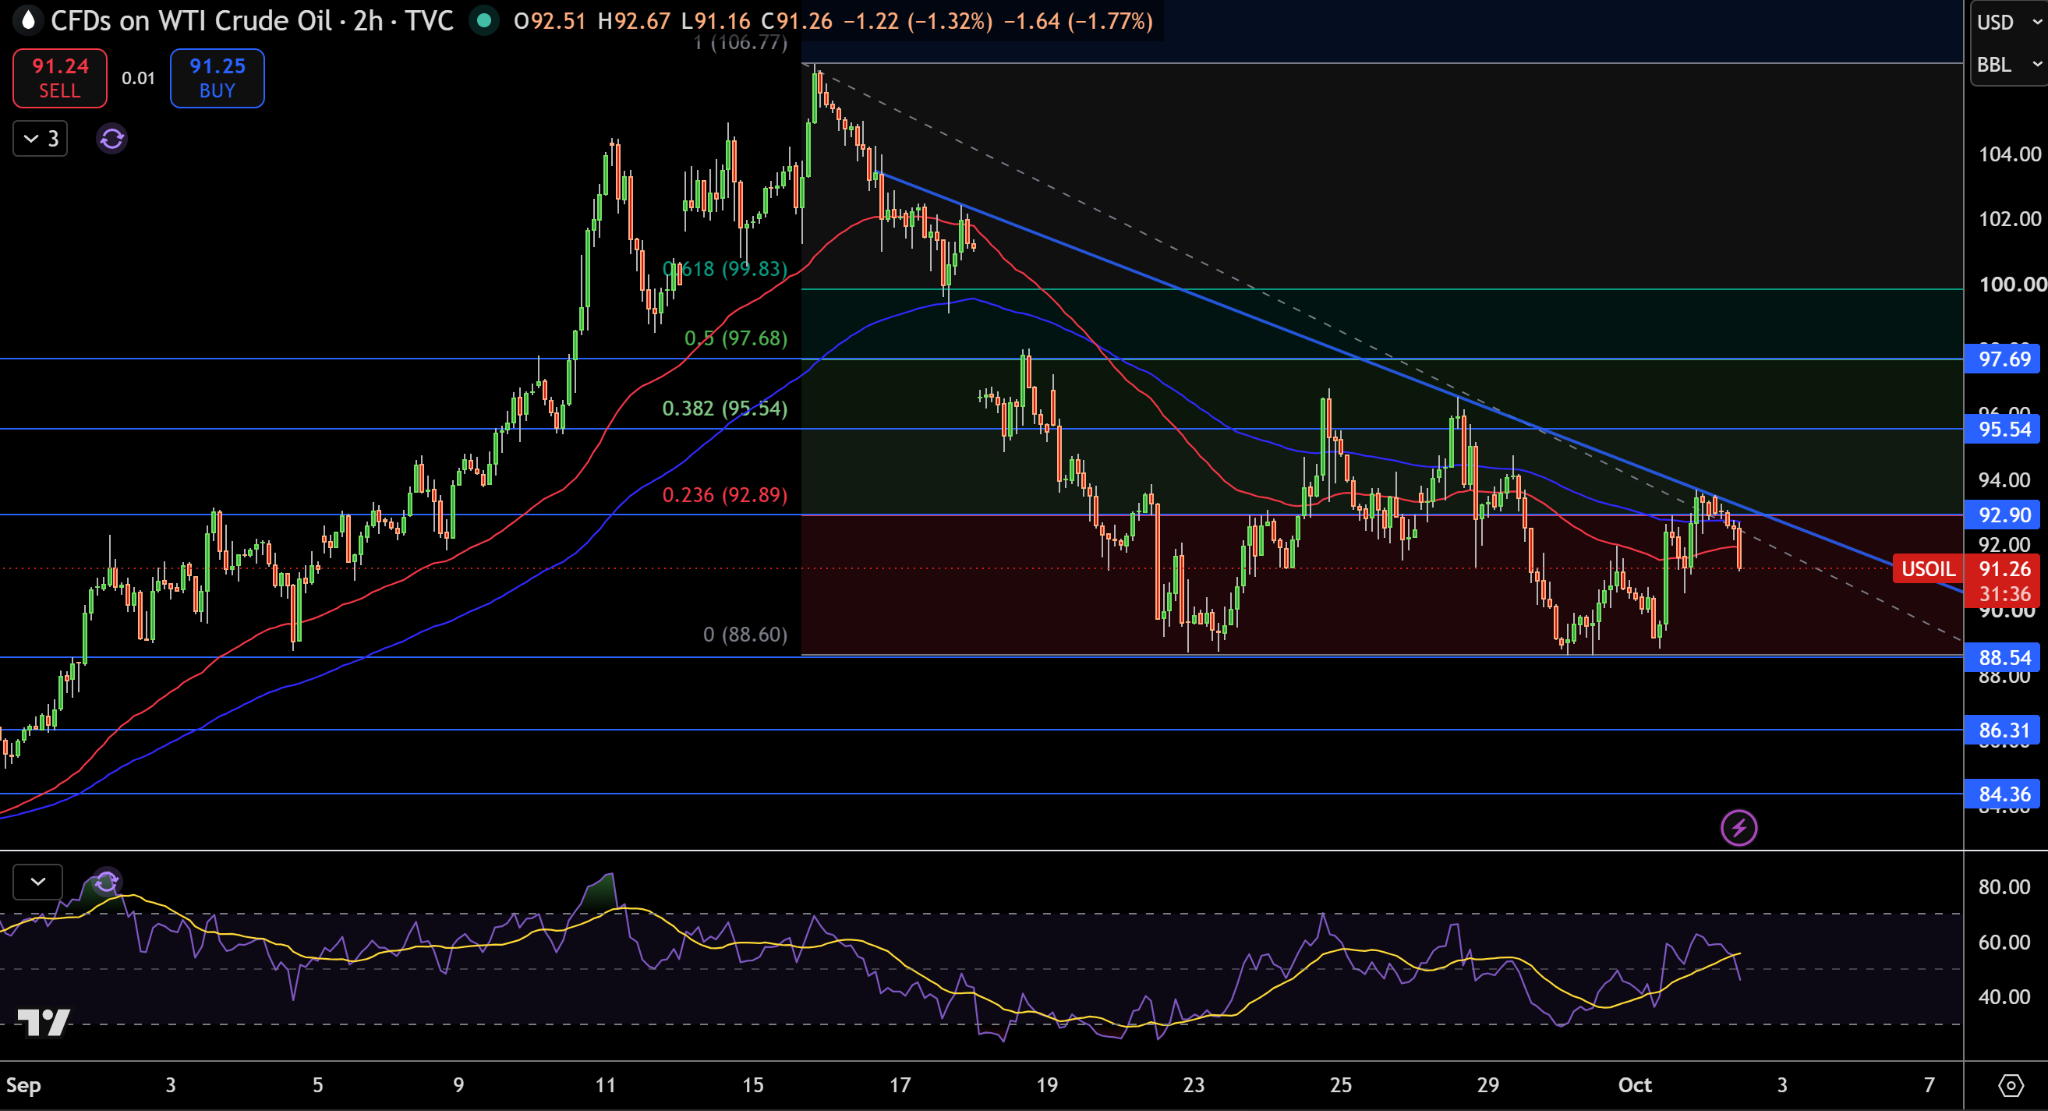
WTI Crude Oil is currently trading at $91.26 on the 2-hour chart. Currently, price has rebounded from the $88.54 support area but is still trading below both the moving averages and the trendline. Price has formed a series of lower highs and the trend is still down. Recent price action is encouraging, however the overall structure is still corrective, and therefore I believe the current price action is part of the larger decline that began from $92.90.
$92.90 will be the first level of resistance. A break above that level will be targeted at $95.54, then $97.69 and $99.83. The $88.54 support holds with the next supports at $86.31 and $84.36.
RSI has bounced from the lows and has eased from over sold conditions. I like shorting WTI crude oil as long as it remains below $92.90 and the trendline. I would take a more bullish view if price were to break and close above $95.54. I would take a more bearish view if price were to break below $88.54 and target $86.31.
Brent Crude Oil Technical Analysis: UKOIL Holds Above $98.71 as $103.89 Becomes the Next Upside Test
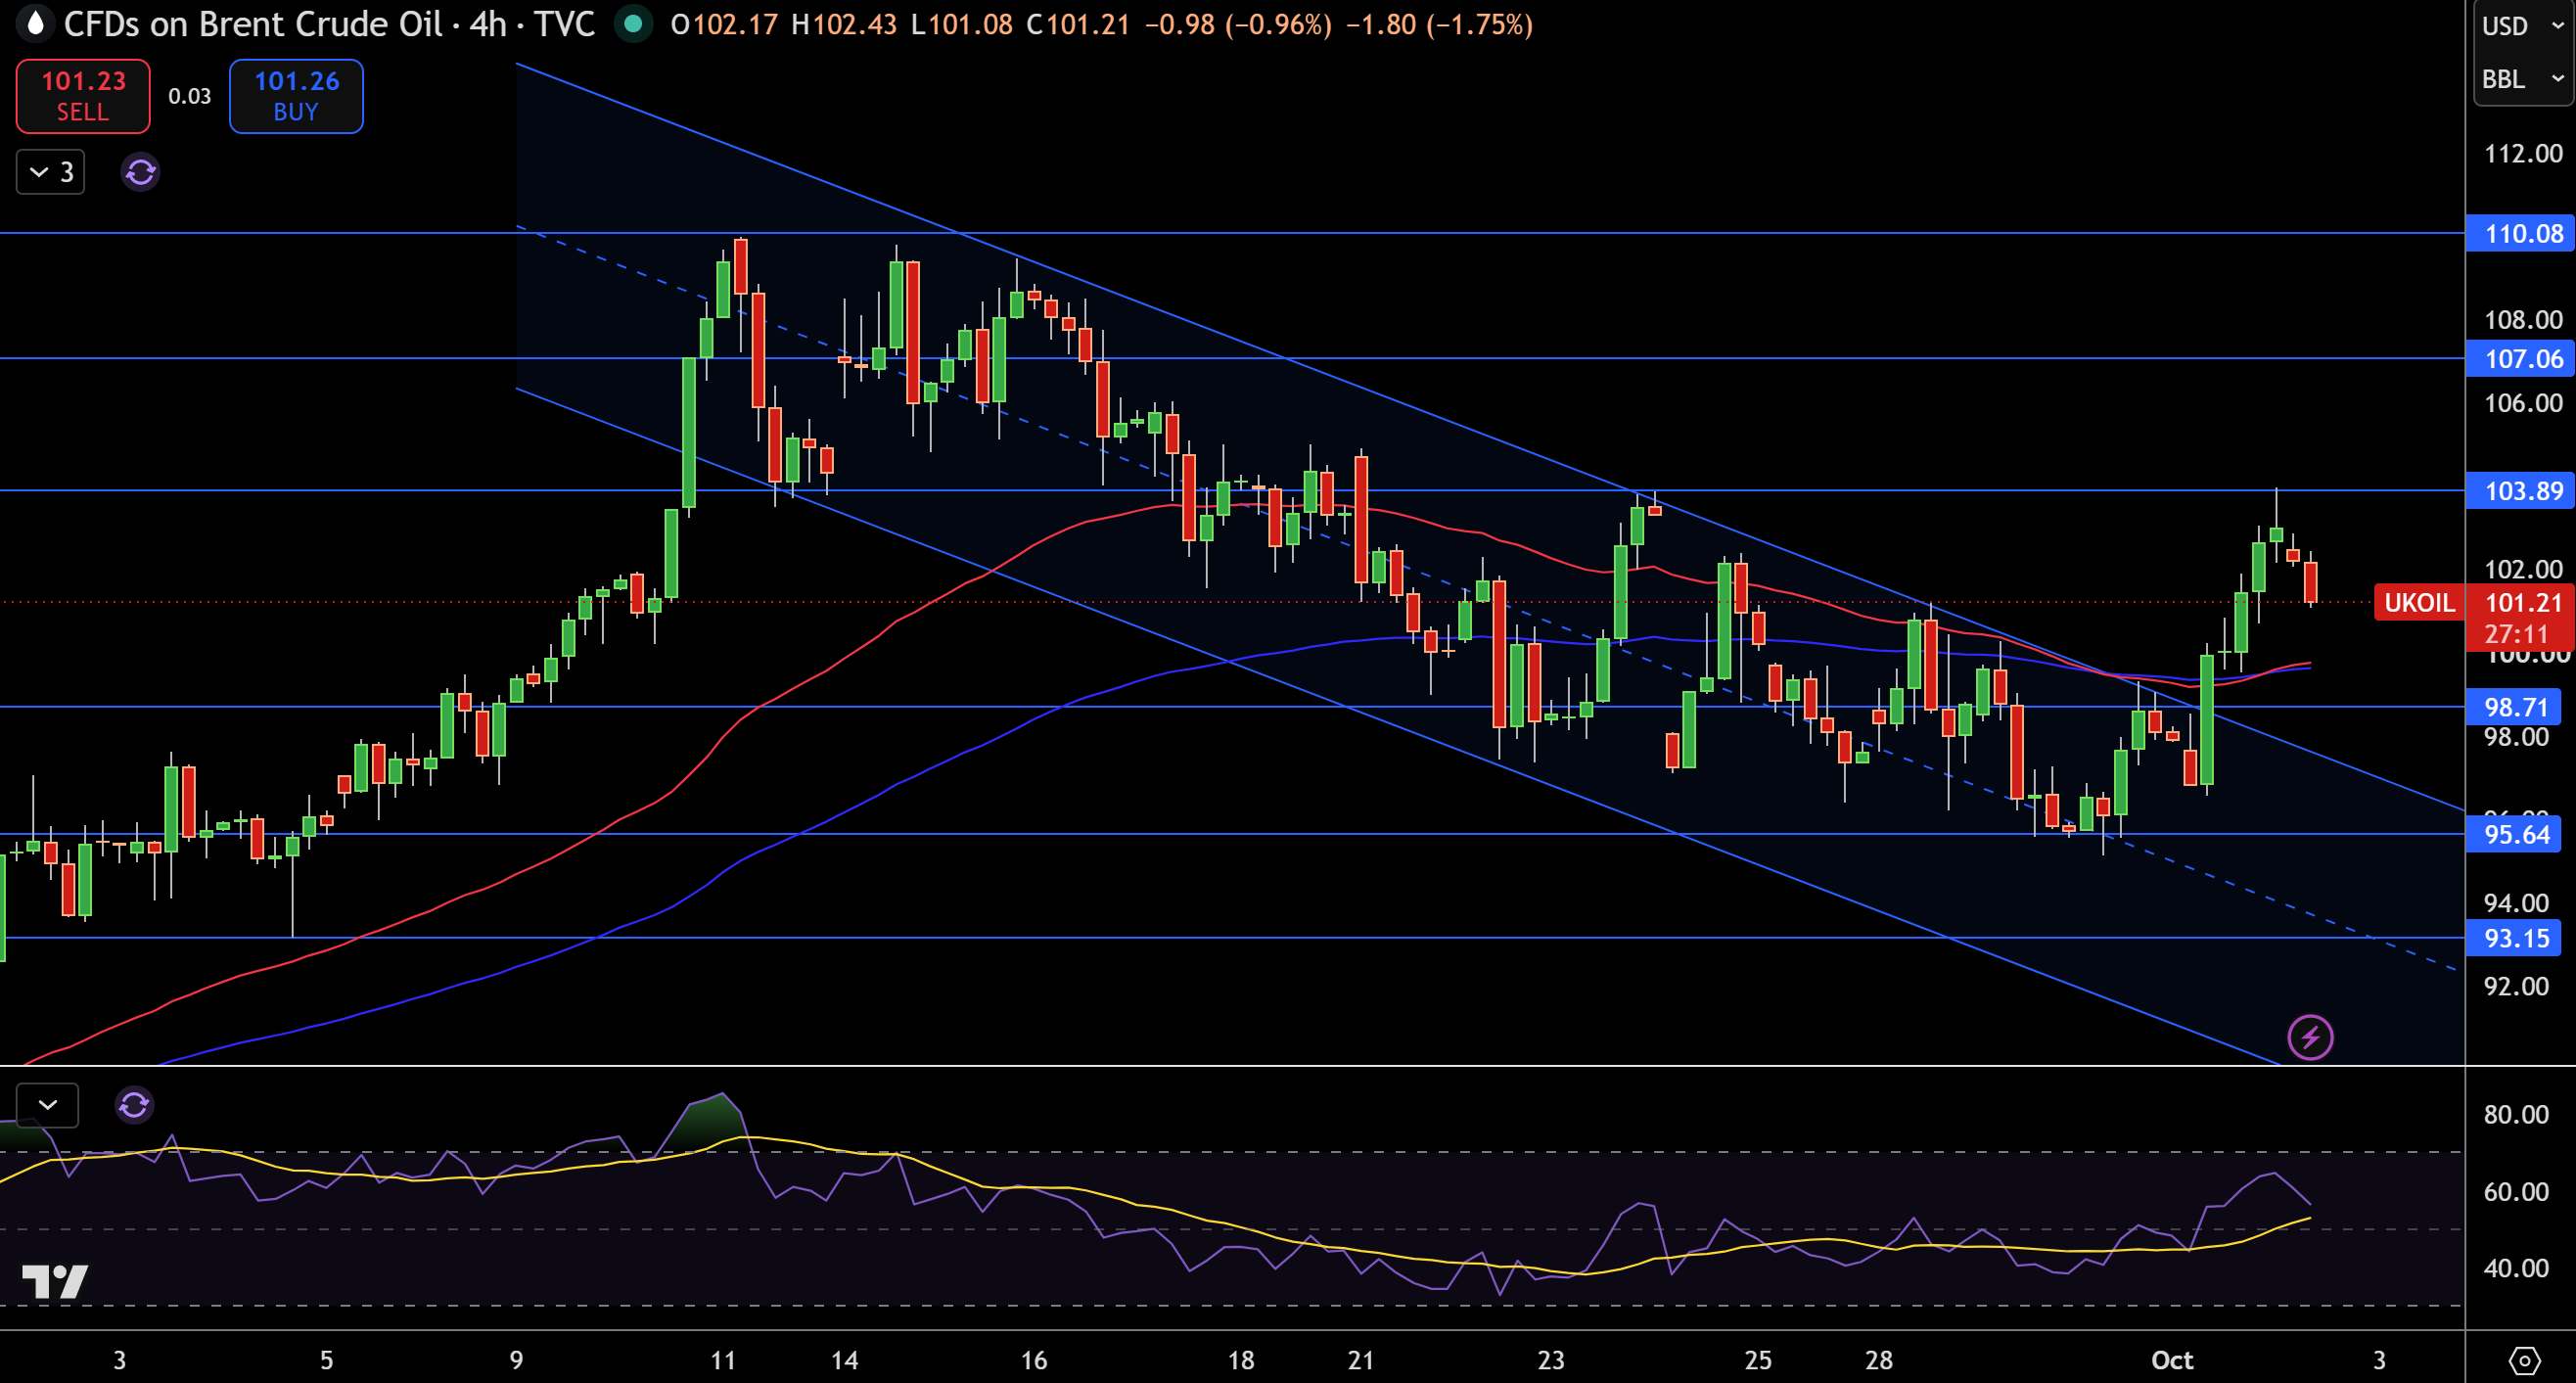
Brent is trading at $101.21 on the 4-hour chart after breaking above the broader descending channel and reclaiming the moving average. What is interesting is that this recovery has changed the short-term structure more meaningfully than WTI and Brent is currently holding above $98.71 after breaking out from $95.64.
The first resistance is at $103.89, with $107.06 and $110.08 next in line. Looking at the lower side, $98.71 would be the first support with $95.64 and $93.15 coming in next if the breakout starts to fail.
RSI is above the 50 line, showing that the bulls are in control. I will remain bullish as long as Brent remains above $98.71. A close below $95.64 would put a reversal in focus, and a break above $103.89 would turn the focus to $107.06.


