$4,111 Support Enters Focus
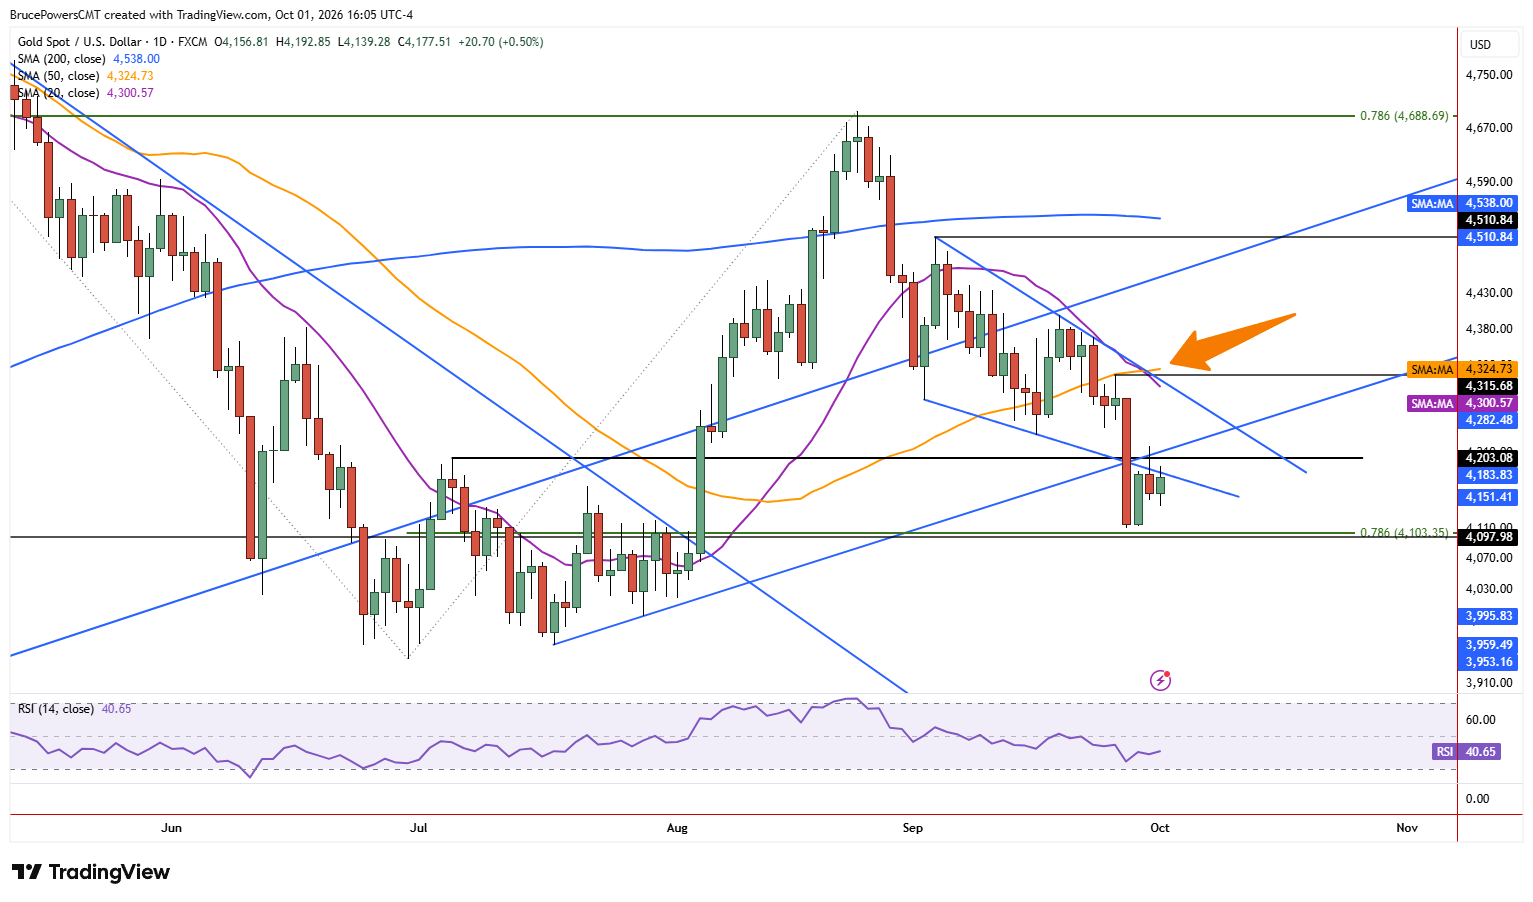
Gold remains below key resistance on Thursday, showing continued downward pressure and the potential for further downside. At the same time, key support at this week’s low of $4,111 completed a 78.6% Fibonacci retracement, indicating the possibility that support could hold and lead to strength. That zone now takes on added significance since September ended with monthly support at $4,111.

Monthly Chart Could Confirm or Reject Bearish Pressure
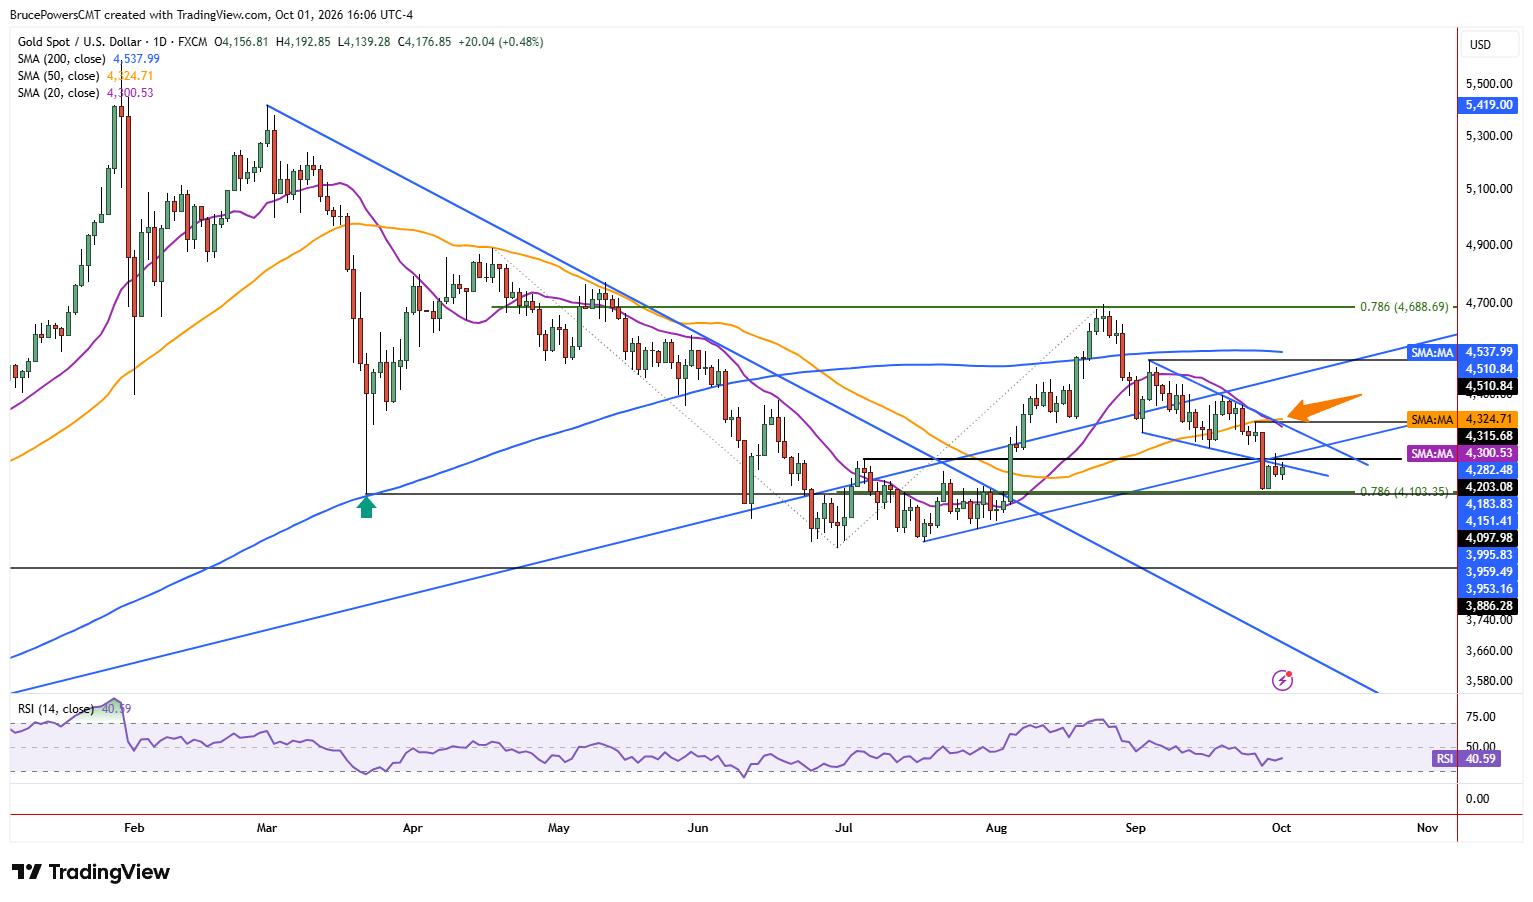
Technically, gold is bearish on both the daily and weekly charts, and a bearish signal will trigger on the longer-term monthly chart if there is a sustained decline below last month’s low. That could result in further selling pressure and likely testing of support near the June low of $3,942. Moreover, if monthly support holds and it is followed by strength, the monthly timeframe will not be confirming bearish signals seen in the shorter timeframe charts. Overall, that would be supportive of a potential recovery.
Rallies Face Resistance in Downtrend
As noted above, price action continues to be bearish and needs to show strength before the possibility of a rally improves. It is also important to remember that rallies will be heading into resistance in a downtrend structure. Therefore, moves may be less reliable and sustainable.
$4,219 Sets First Recovery Trigger
Since a lower swing high of $4,219 has been established at Wednesday’s high, that is short-term resistance and the first level that would need to be recovered before there is a chance that gold goes higher. Resistance that would follow is near the lower swing high at $4,316. A recovery above each of those levels would signal a reversal of the very short-term downtrend, which is bullish.
Confluence Near $4,316 Raises Stakes
The $4,316 area gains significance since it is reinforced by the confluence of several indicators, including the 20-day and 50-day moving averages, and a downtrend line. A sustained reclaim of the moving averages, now near $4,300 and $4,325, respectively, would be a sign of strength that may be sustainable. The next key upside target would then follow at the lower swing high of $4,511.