Natural Gas Technical Analysis
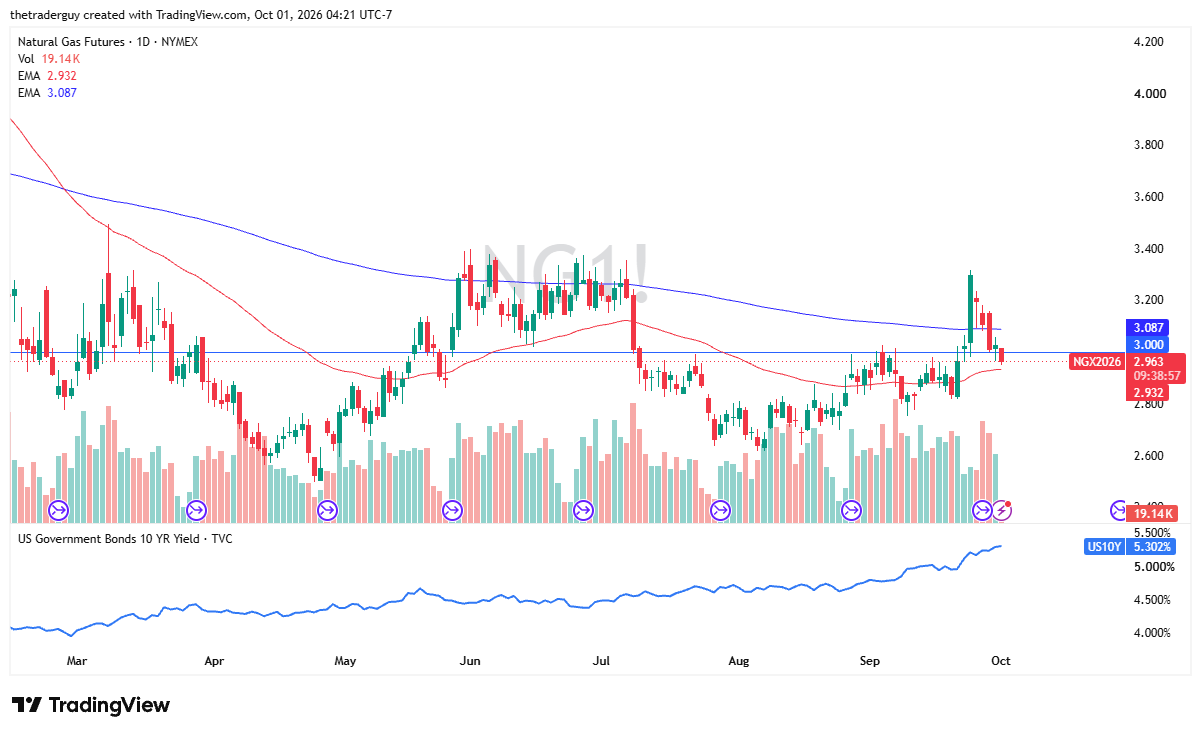
The natural gas market has dropped during the early part of the Thursday session as we sit between the 50-day EMA below and the 200-day EMA above. This area has been fairly choppy, and I wouldn’t expect much different in this environment.
Keep in mind, on Thursday we’ll see the natural gas storage numbers come out of the United States. The expected figure is 63 billion cubic feet added. We’ll have to wait and see how that plays out. Anything above 63 billion cubic feet would be bearish. Anything below it could give us a little bit of bullish pressure.

Seasonality Is Key for This Contract
We’re just now getting into the November contract, and November does see a little bit more burn. It’s the beginning of the cold season in the northeastern United States, and therefore we start to see prices typically rise with more inventory coming off the market. This is what we will be waiting to see before getting overly bullish as a market.
Short-term drops from here could see this market breaking through the 50-day EMA. If it does, then the $2.80 level becomes an area that I watch very closely. To the upside, if we can break back above the $3 level, we have to pay attention to that 200-day EMA, as it typically is followed by traders, and then $3.20.
With that storage number coming out today, though, it could be a bit choppy and indecisive until we get that out of the way. This is an area of the chart that you see a bit of technical noise at as well, lining up for a move.
If you’d like to know more about how to trade natural gas, please visit our educational area.