WTI Crude Oil Technical Analysis
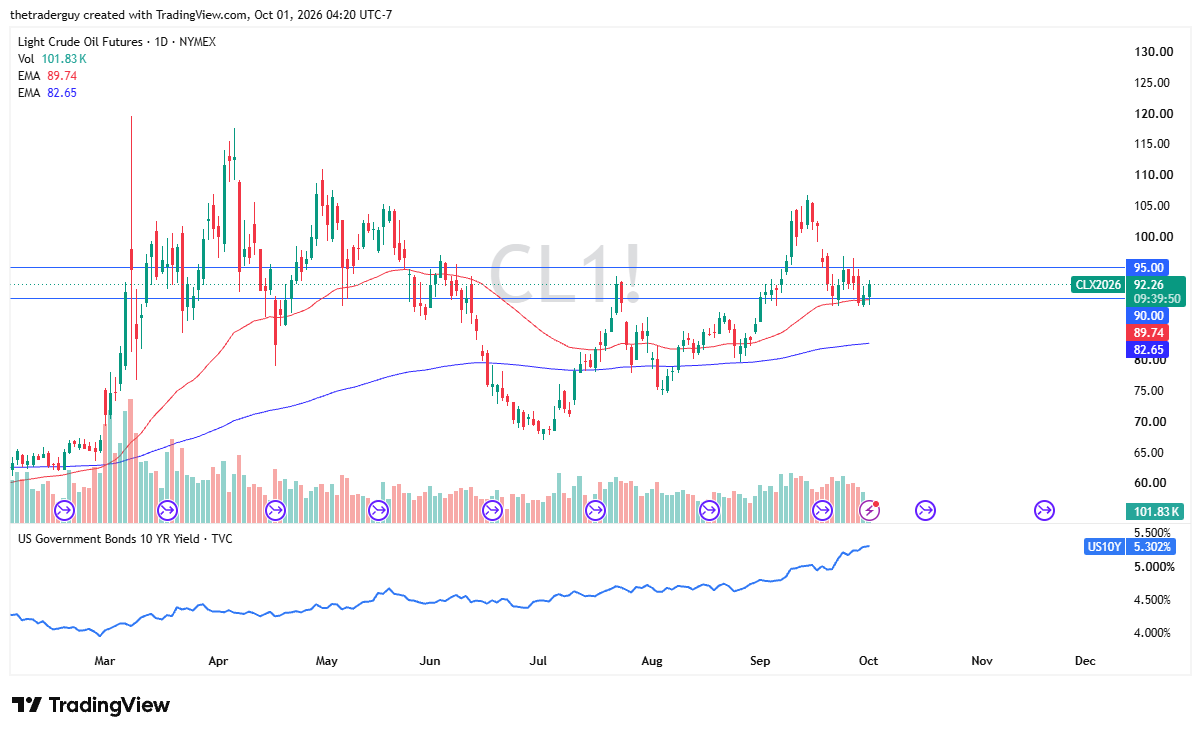
The light sweet crude oil market has rallied just a touch in early trading on Thursday, bouncing from the $90 level as we continue to hang about and try to figure out where we are going next. After all, this is unfortunately a market that is going to be driven by the latest headlines.
Brent Oil Price Forecast
Every new Brent Oil analysis as it publishes, today's technical signal and key levels, live price — on one page.
See all Brent Oil forecastsThe latest headlines at this point in time are being driven by the latest comments coming out of either Tehran or Washington, D.C. With that being the case, and with the uptrend line being tested and bouncing from there, it suggests that we are perhaps just going to at least hang out in this consolidation channel. We will have to wait and see.
I certainly am not bearish on oil right now, and being at the 50-day EMA, as well as the $90 level, there is a technical reason to get interested here.

Brent Technical Analysis
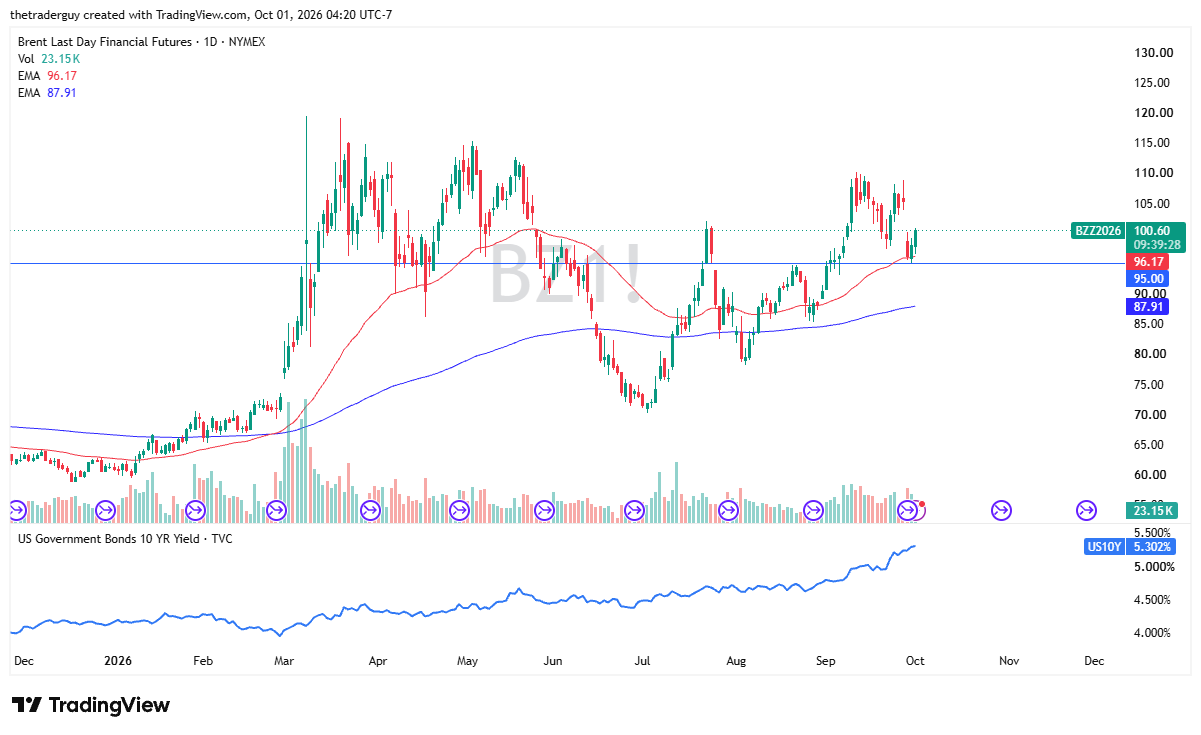
The Brent markets look pretty much identical. We have bounced from the 50-day EMA and the $95 level. It now looks like we have an eye on that gap. We will have to wait and see.
Ultimately, rising rates suggest that people are still worried about energy inflation, and with that, we will have to see whether or not short-term dips get bought into. It certainly looks like $95, at the moment, is a bit of support.
Unfortunately, this is the type of market that is very difficult to trade, as traders make decisions based on the latest freakout. The latest freakout can come at any given time. The situation in the Middle East—they are talking. That is a good sign, but whether or not they will actually come to some type of conclusion remains to be seen.
If you’d like to know more about how to trade natural gas, please visit our educational area.