



USOIL, UKOil & Natural Gas Outlook: Gulf Exports Recover as U.S. Inventories Rise and LNG Flows Improve
On Thursday, oil fundamentals were bearing slightly lower. Analysts cited an increase in U.S. crude stockpiles and recovering Gulf Coast exports as helping to ease concerns about a potential global oil shortage. However, concerns about the Strait of Hormuz were not eased.
From a price and fundamentals perspective, the biggest story right now is the recovery in Middle Eastern supplies. According to Goldman Sachs, total crude oil shipments from the Middle East are now around 23.3 million barrels per day. Also, recent loading of crude oil from the Red Sea’s Yanbu Port and the reopening of the East-West Pipeline give Saudi Arabian producers additional flexibility in avoiding the Hormuz Strait.
From a prices and fundamentals perspective, the unexpected build in U.S. crude stocks adds bearish momentum. But,, OPEC+ is expected to leave its policy unchanged, maintaining the status quo on production levels.
Diplomatic avenues are still open. The White House has responded to Iran’s proposed confidence-building measures through Qatar. The points of contention have moved to the particulars of the phased measures to reopen shipping in the Strait of Hormuz.
There have been recent incidents. Maritime risks returned to Hormuz on Tuesday with three oil tankers reportedly hit by projectiles.
In the liquefied natural gas (LNG) market, vessels are starting to pass through Hormuz again, but the overall LNG market is still feeling the effects of the Qatari supply disruptions.
The U.S. is continuing to build natural gas inventory, with the EIA projecting record gas production for 2026. LNG carrier bookings are reportedly being accepted on Norway’s pipeline system, giving the European markets a similar level of reassurance.
We expect a balanced market for crude oil and oil products. The United Kingdom and natural gas markets are expected to be range-bound.

Natural Gas Technical Analysis: NG Breaks $3.00 Support as $2.95 Becomes the Next Downside Test
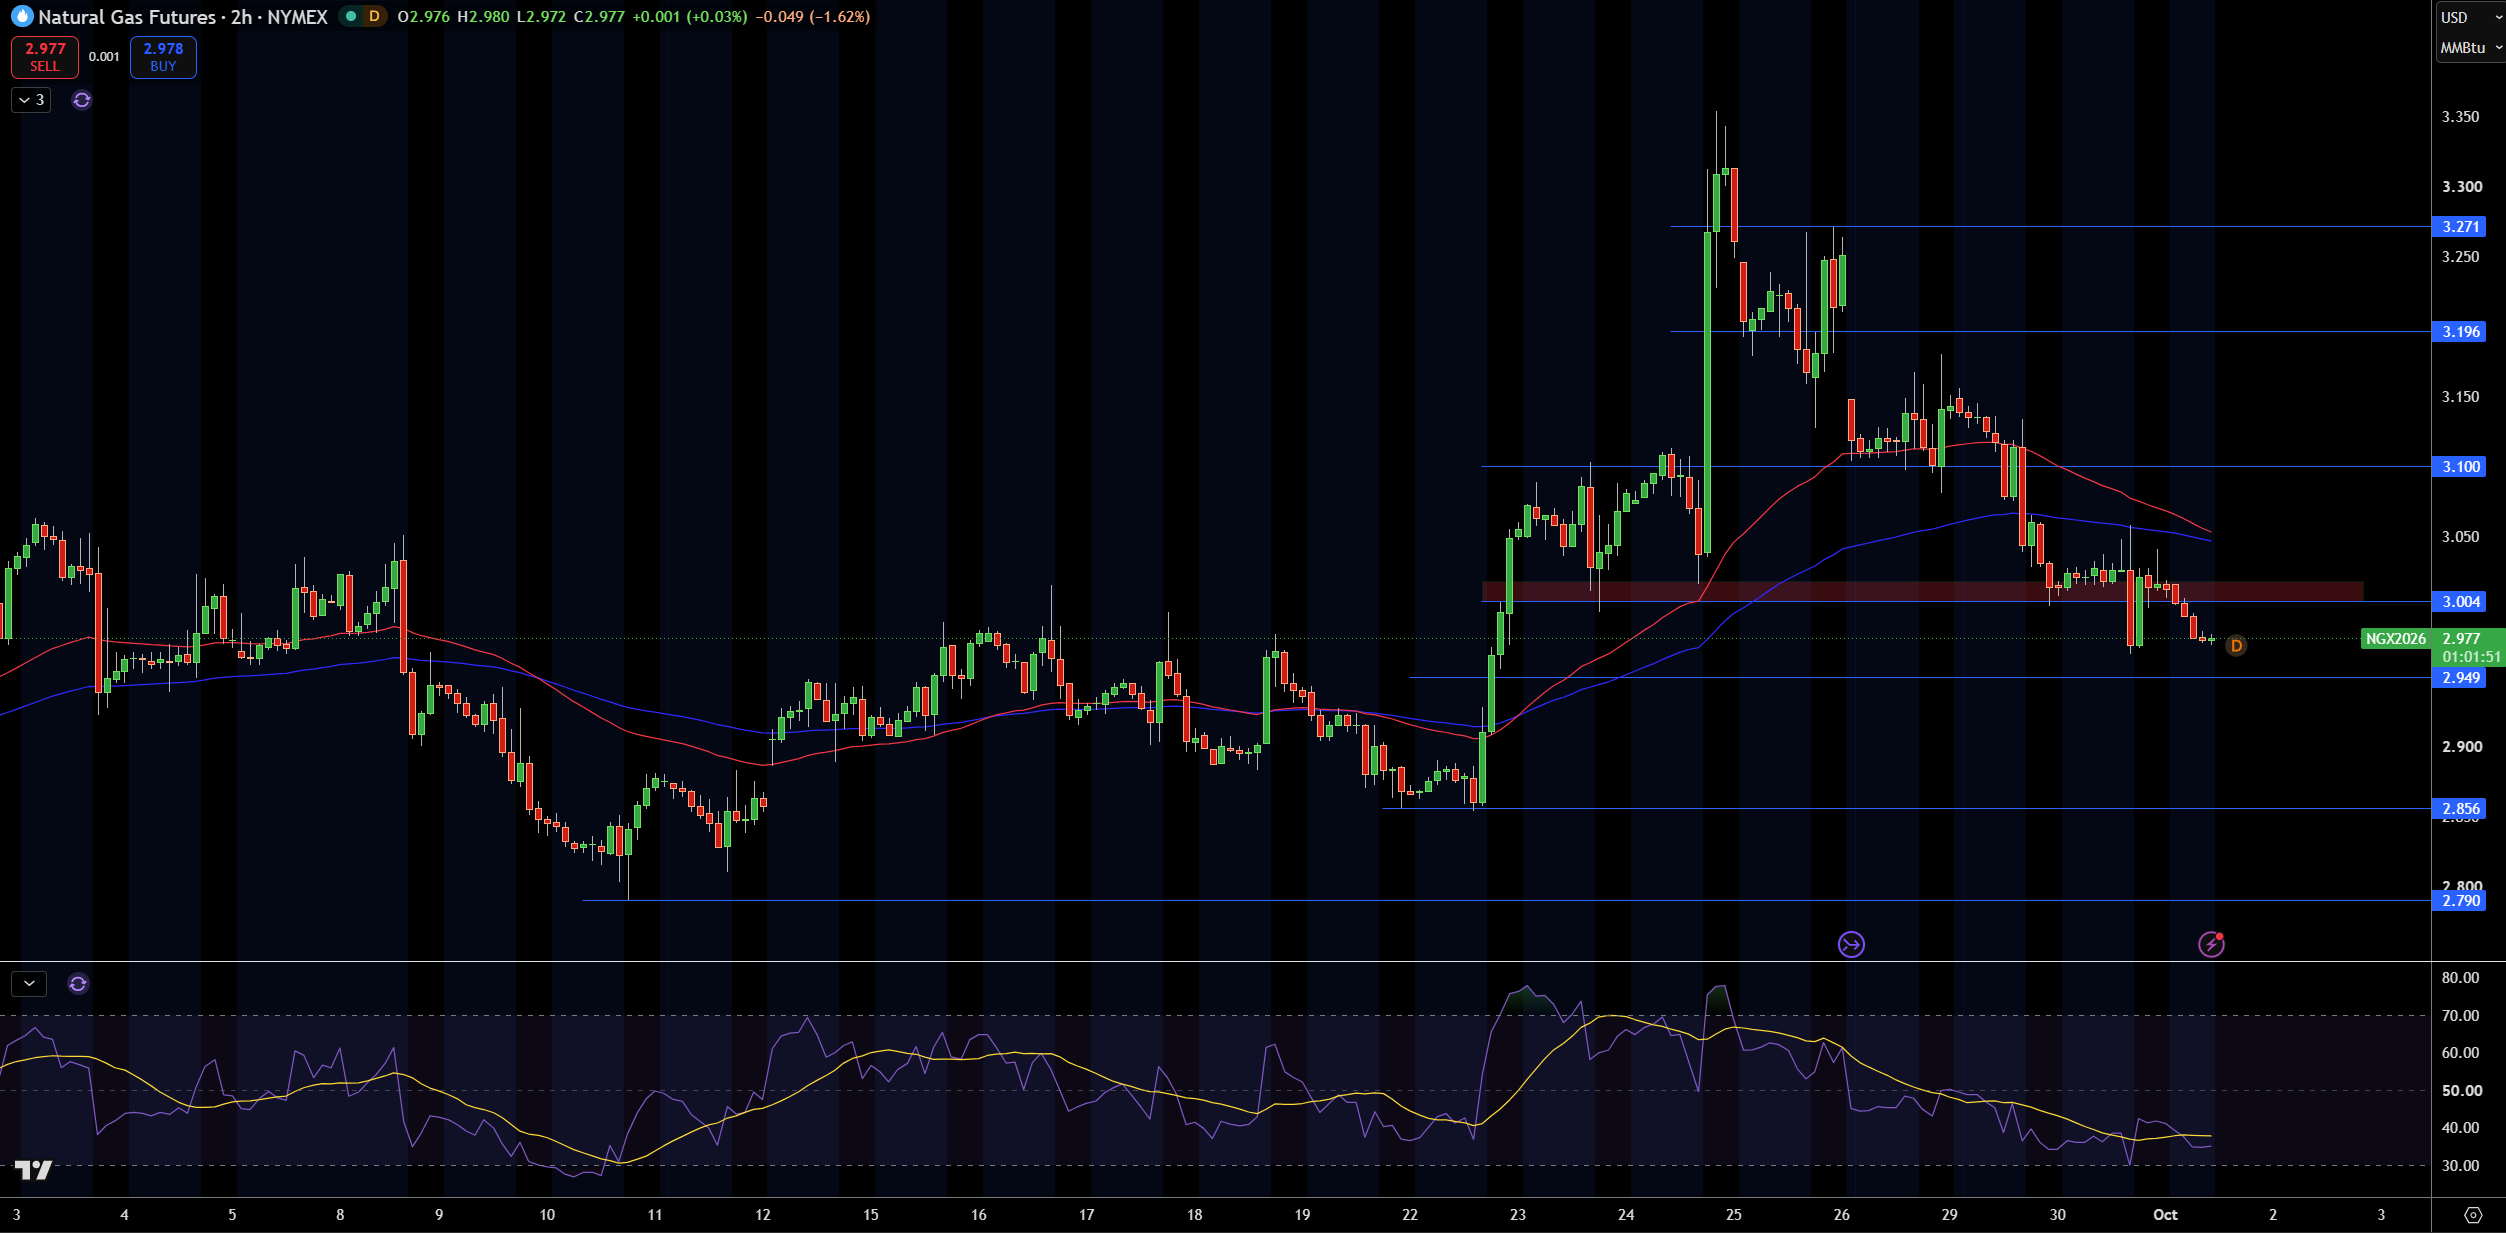
NG is trading at $2.98 on the 2 hour chart, having lost the $3.00 support and both moving averages. The more bearish price action becomes evident when you consider that NG has also lost the rising trendline that had been supporting the uptrend. Also, prior support has become prior resistance at $3.27.
I see the next major support at $2.95. Breaking below that targets $2.86 and $2.79. The 100 SMA at $3.00, and the 200 SMA at $3.10 and $3.20, provide the next major resistance levels.
Momentum, as measured by the RSI, is in bullish territory, but not by much. I see the overall bias as bearish until NG is trading above the $3.00 and the 200 SMA, as well as the 100 SMA. If NG trades above $3.10, I will look for this bearish bias to reverse. A break below $2.95 strengthens the case for a move to $2.86.
Natural Gas Price Forecast
Every new Natural Gas analysis as it publishes, today's technical signal and key levels, live price — on one page.
See all Natural Gas forecastsWTI Crude Oil Technical Analysis: USOIL Rebounds From $88.71 as $92.97 Remains the Key Recovery Test
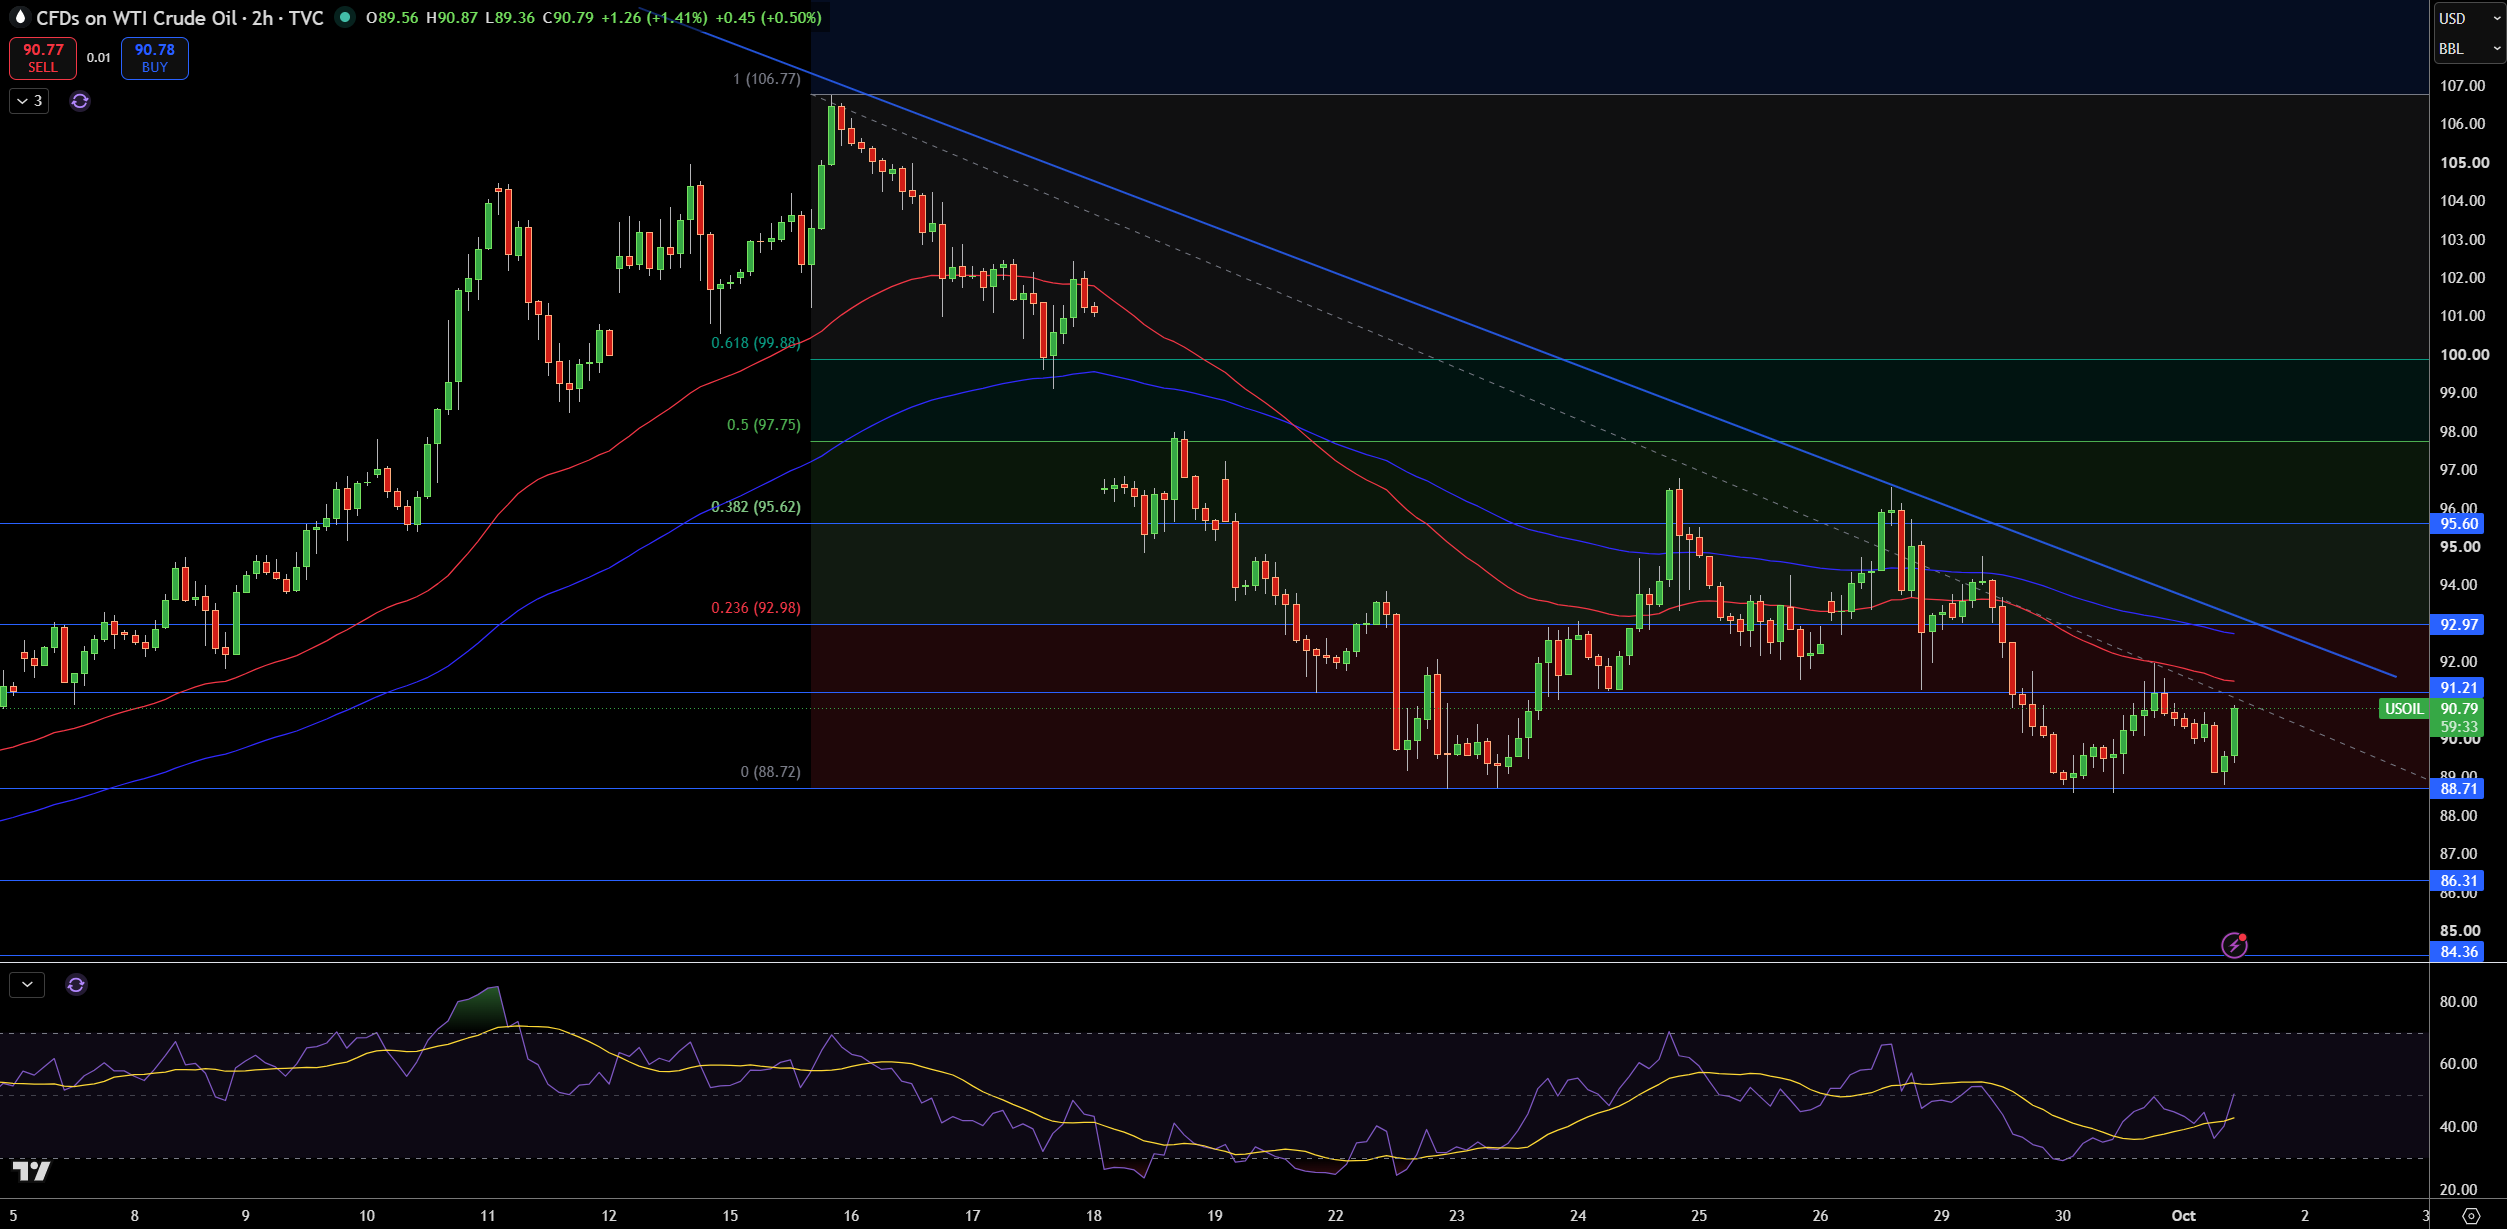
USOIL reaches $90.79 on the 2-hour chart and is trading between support at $88.71 and resistance at a descending trendline and both moving averages. From the support at $88.71, buyers have pushed price higher, but the selling pressure from the trend continues to pull price lower.
If resistance at $92.97 is overcome, further resistance may be found at $95.60, $97.75, and $99.88. $88.71 continues to provide support and is followed by additional support at $86.31 and $84.36.
The RSI is recovering from a low and indicates that the trend may change from bearish to flat. Unless WTI trades above $92.97, and the moving averages, the trend will remain bearish.
If support at $88.71 is lost, $86.31 is expected to provide support.
From the support at $88.71, traders may find it prudent to take a bullish position on WTI as the next expected support is $84.36.
Brent Crude Oil Technical Analysis: UKOIL Tests Descending Trendline as $99.27 Becomes the Breakout Level
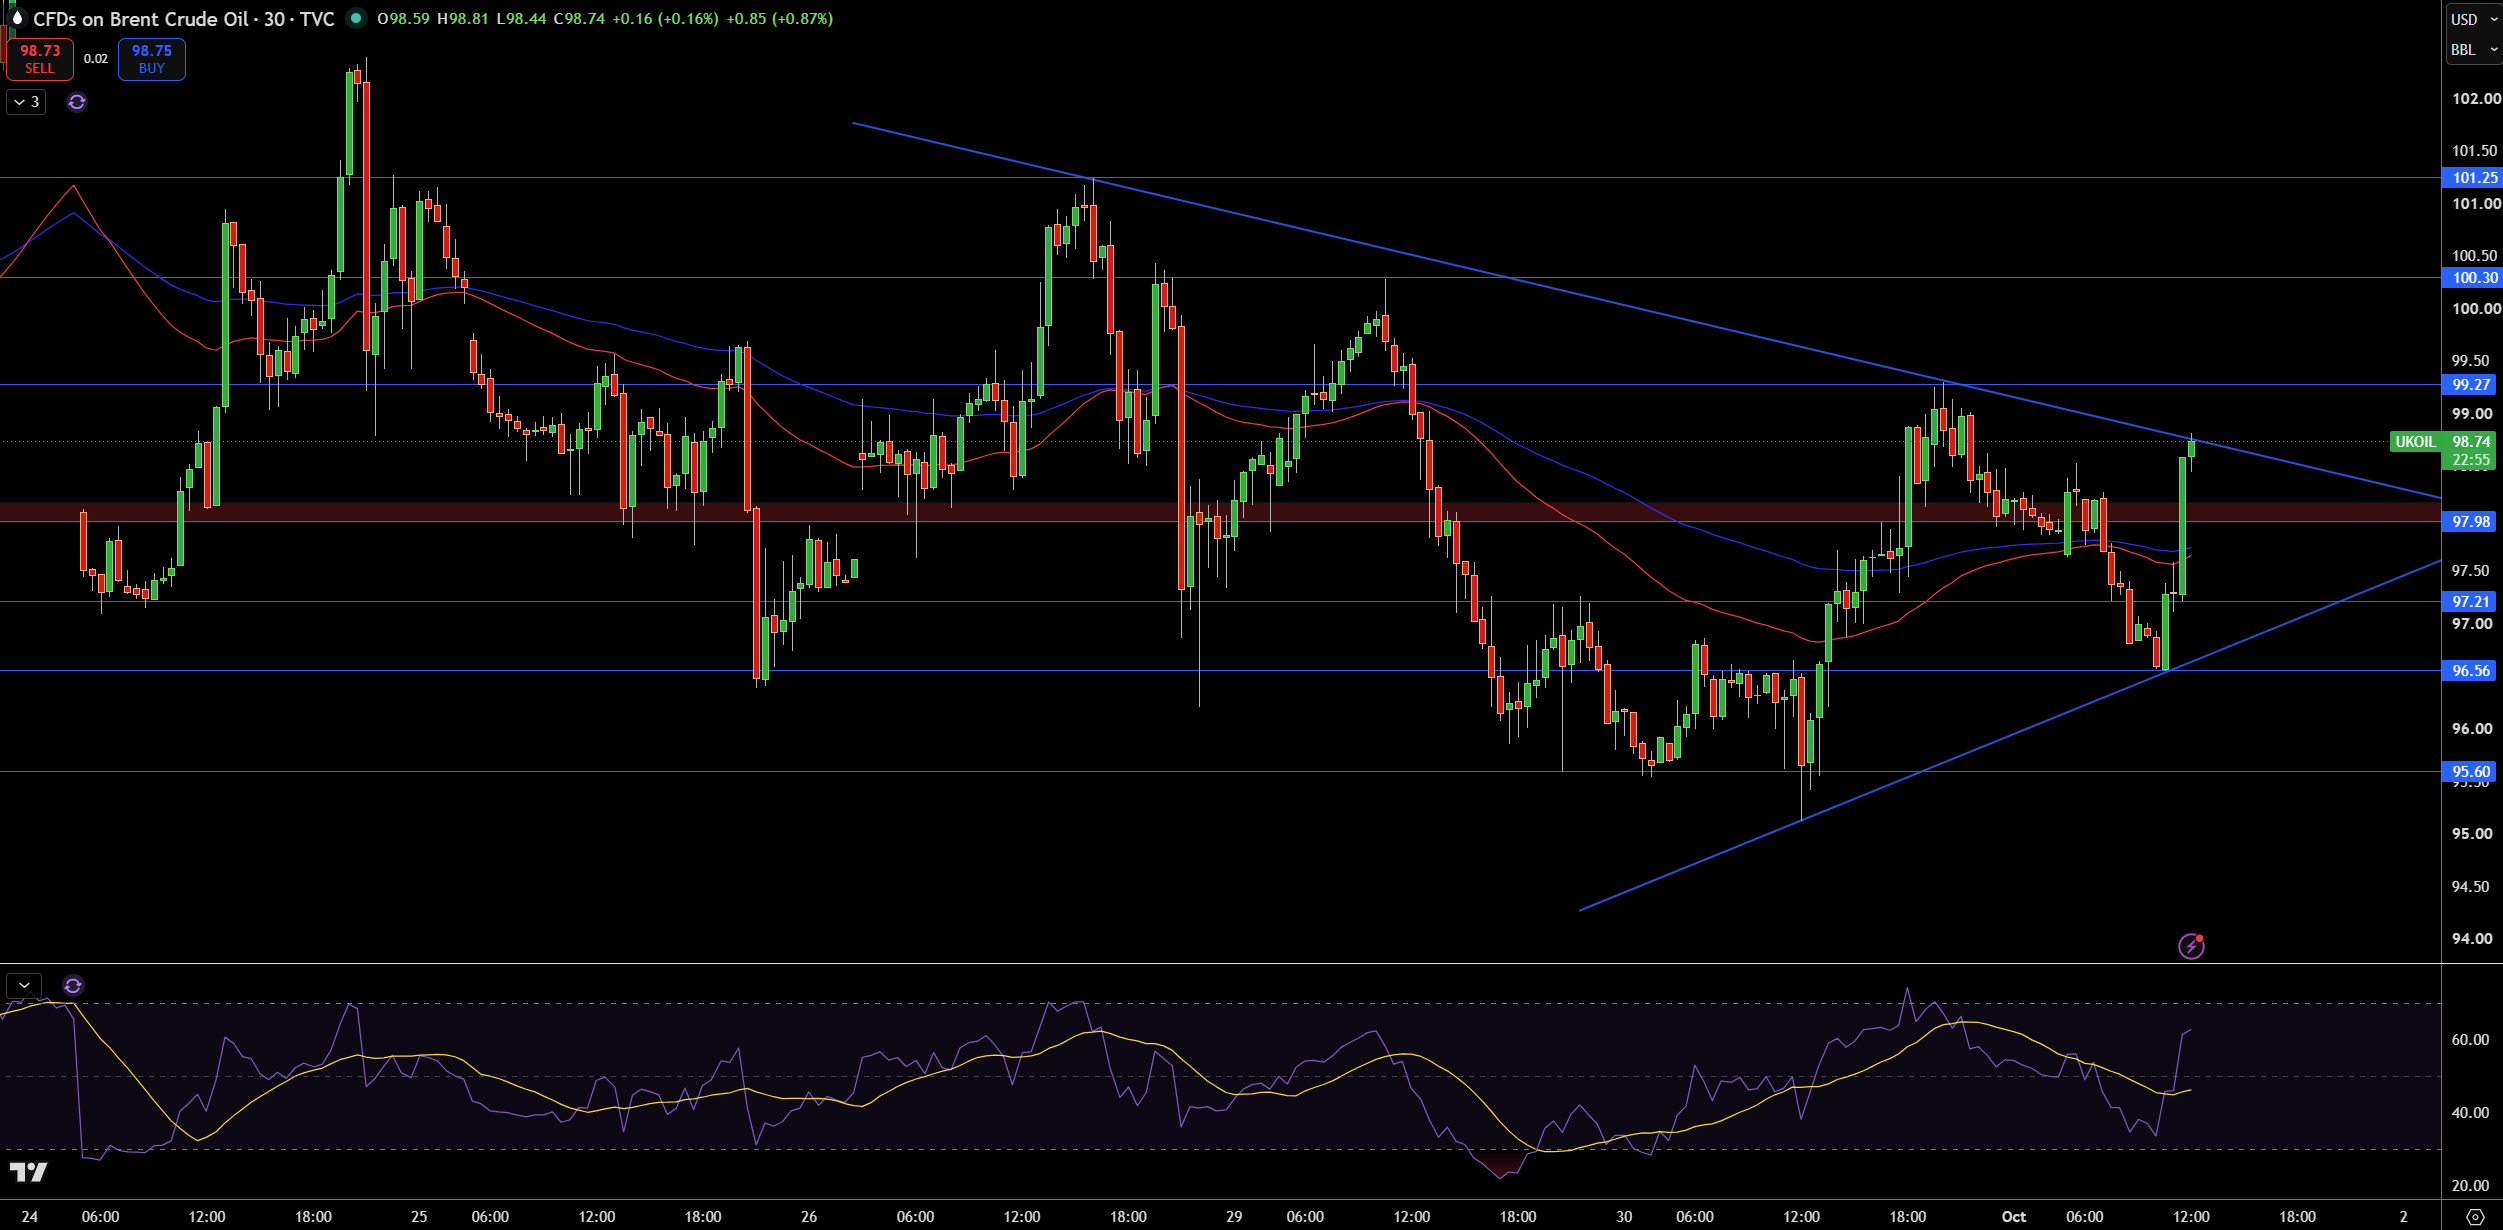
Brent crude is currently trading at $98.74. Recently it traded as low as $96.56. During the move lower it lost support of the 10 and 20 moving averities. As it traded lower it lost the support of the 100 moving average and found support at $96.56. Currently the price is trading above all three moving averages and is challenging a resistance trend line.
There is resistance at $99.27 and above that $100.30 and $101.25. There is support at $97.98 and $97.21. If price breaks the support at $95.60 that would also indicate a break of the support trend line.
RSI is also supporting the bullish view. If price trades below ~$97.98 it would be bearish. I would look for a move below $96.56. If price trades above $99.27 it would be bullish and indicate that the $100.30 level would be tested. A move below $97.21 would be a bearish signal and a move below $96.56 would indicate that the trend line touch is a test and the trend is still lower.


