Failed Recovery Reinforces Resistance
Gold remained under downward pressure Wednesday, as bond yields hit new highs and the U.S. dollar remained firm. A bounce to a two-day high of $4,219 was quickly followed by increased selling pressure that remains at the time of writing. Trading continues near the low of the day, currently at $4,147. Resistance for the session was seen near the lower swing high of $4,203 from July. The quick bearish reaction after signs of strength and the rejection near that prior high further confirm resistance near $4,203. This is bearish because it signals a failed bullish reversal attempt following the prior decline.

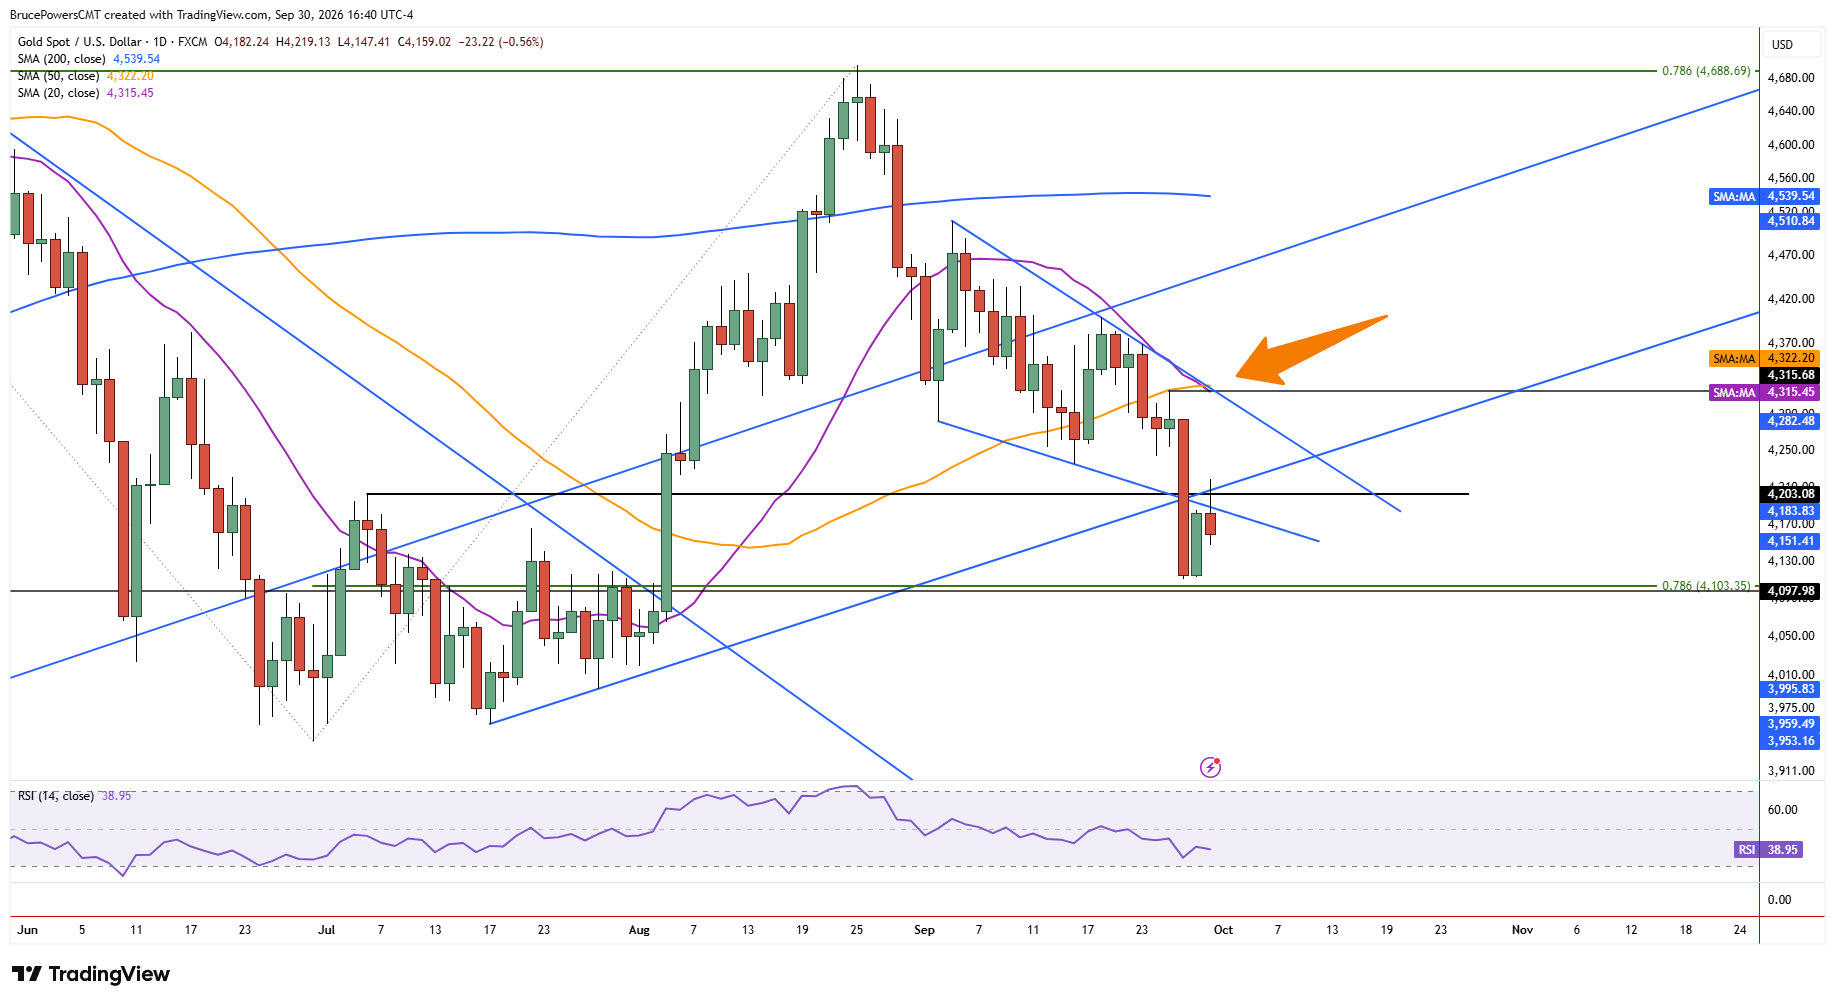
$4,103 Becomes Critical Support
A failed recovery of the July high followed Monday’s bearish continuation signal and confirmed a break below the 50-day moving average. During the subsequent decline there were no signs of support near the $4,203 July high, further suggesting that sellers were getting more aggressive. Support was eventually found at a low of $4,111, which is near the 78.6% Fibonacci retracement of the prior advance at $4,103. Therefore, a decisive decline below $4,103 would open the door to a deeper test of support near summer lows. It would also increase the chance that a new lower swing low may eventually develop, beginning with a decline below the June low of $3,942.
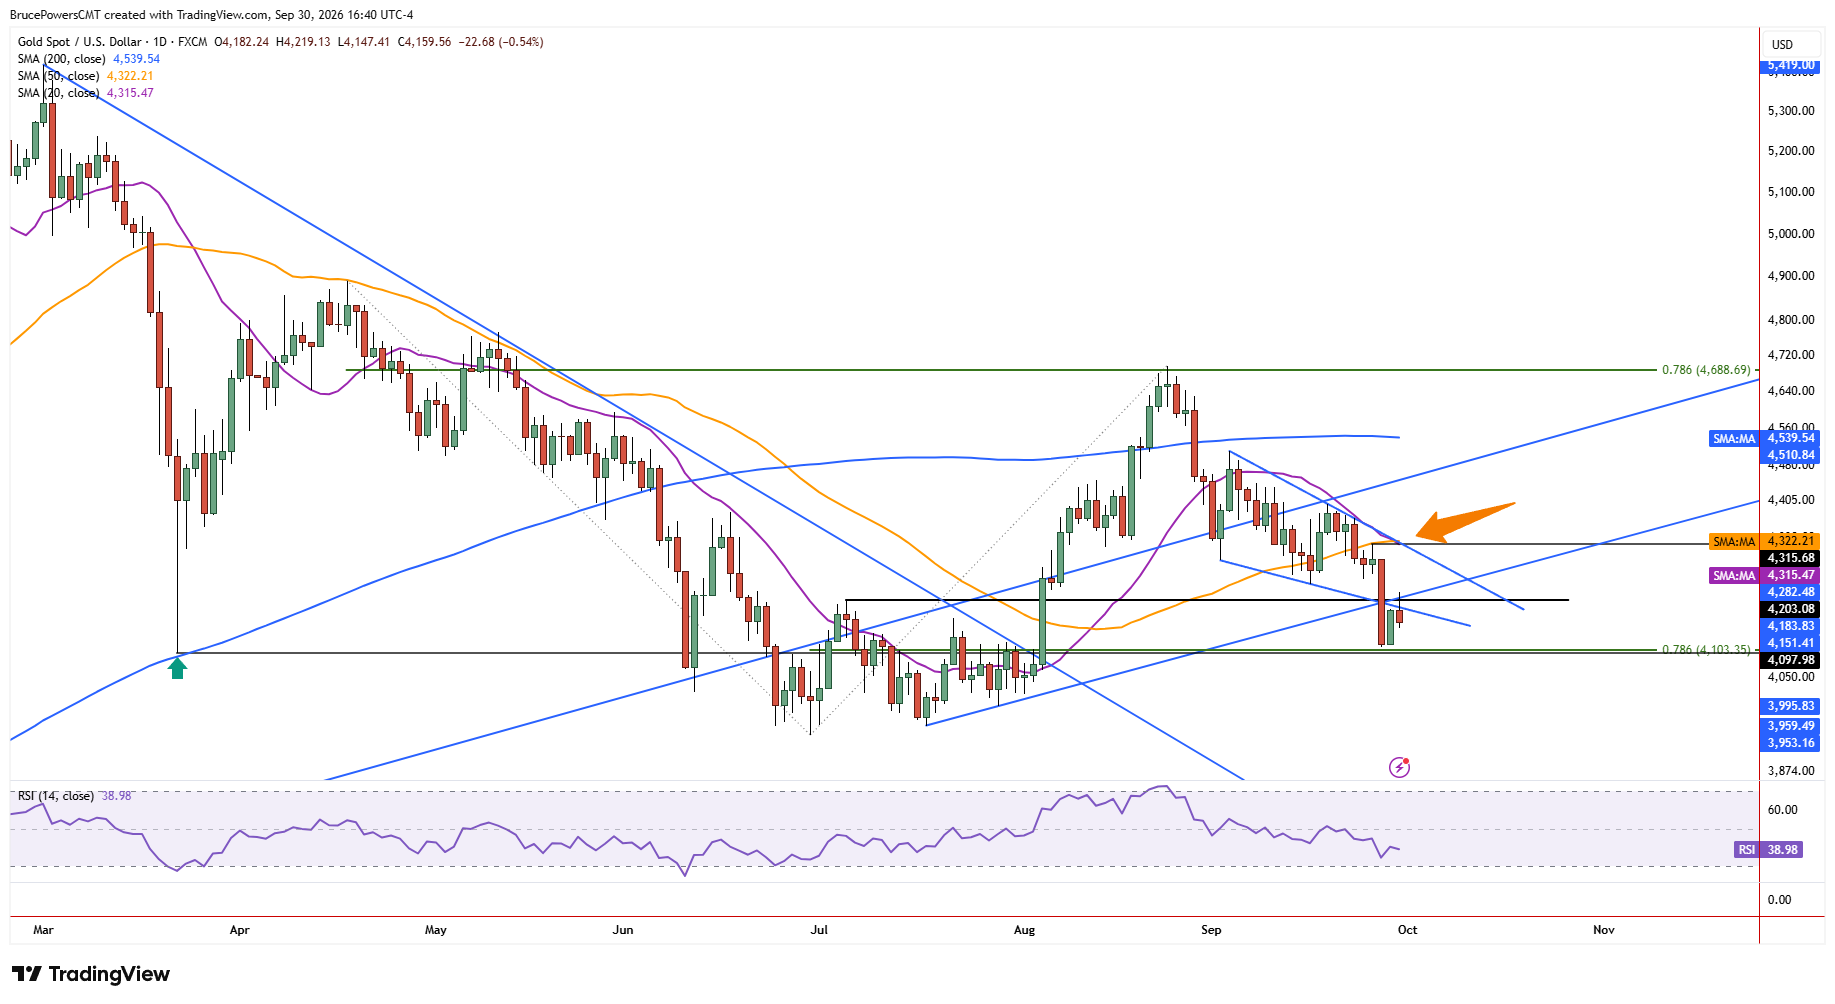
Bounce Faces Multiple Resistance Layers
Indications of strength would begin with a rally above Wednesday’s high. That could lead to a push towards a test of resistance near the minor lower swing high of $4,316 and the 50-day moving average near $4,322. The 20-day line provides another potential dynamic resistance zone as it is aligned with falling trendline. However, it has now converged with the 50-day moving average and will soon cross below it, signaling increasing bearish momentum.
Since the 20-day moving average is falling it will start to mark a progressively lower potential resistance zone below both the 50-day moving average and the lower swing high. This will reduce the potential initial upside of a bounce and may reflect weakening demand. Overall, the technical indications remain bearish, with the path of least resistance still lower unless gold can produce decisive signs of strength that are not currently apparent. A sustained recovery above the nearby resistance levels would therefore be needed to weaken the current bearish structure and signal that buyers are beginning to regain control.
If you’d like to know more about how to trade gold and silver, please visit our educational area.