


Hammer Pattern Builds Higher-Low Case
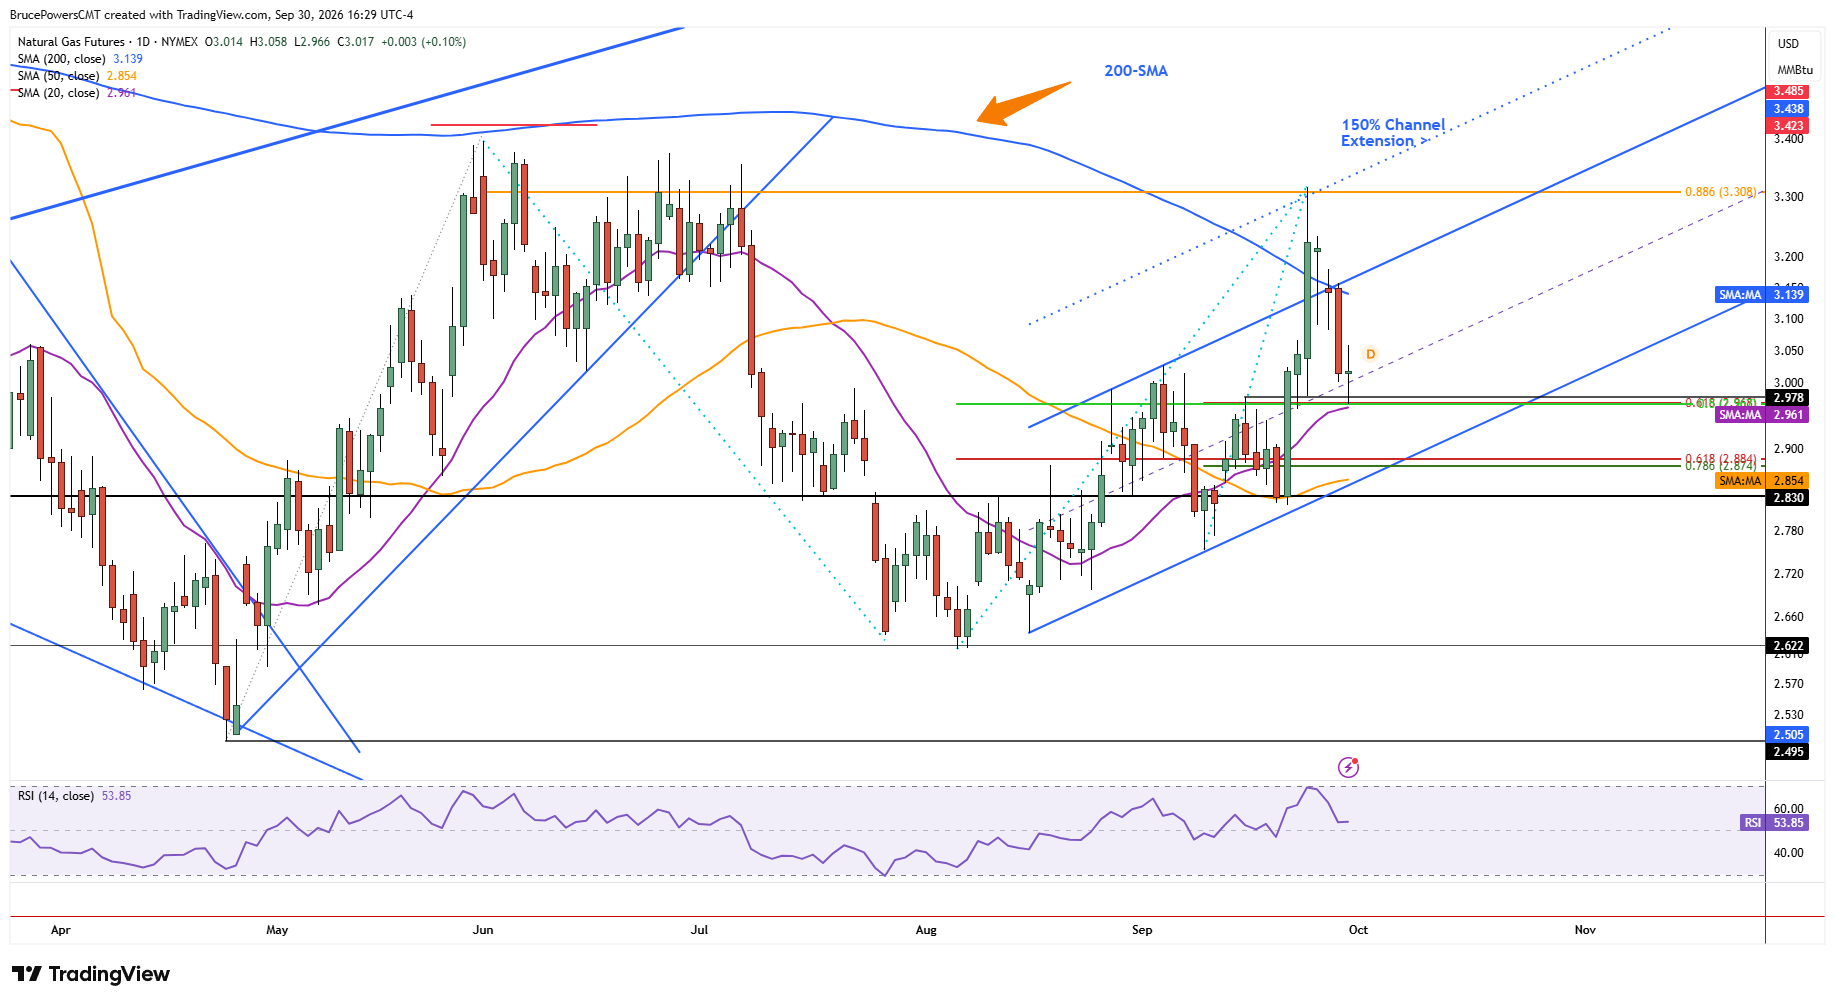
Natural gas reversed higher Wednesday after weakening to a five-day low of $2.966, finding support at an initial confluence zone before buyers regained control. Buyers pushed price into the upper half of the day’s range, suggesting that the session could establish a short-term low and that higher prices may be tested next. This is a short-term sign of strength that is set to produce a bullish hammer candlestick pattern for the day. An upside breakout and bullish reversal signal would occur above Wednesday’s high of $3.058. That would provide the first indication that Wednesday’s low may become a higher swing low.

20-Day Average Anchors Confluence Support
If Wednesday’s low is retained as support and develops into a higher swing low, that would be a sign of strength that potentially confirms a shift to a higher-momentum environment. A steeper angle of ascent for the trend would then be suggested and evidenced by the rising 20-day moving average, which was successfully tested as support on Wednesday. That average was part of the confluence zone that also included the lower swing high of $2.978 and two Fibonacci levels. Although this does not guarantee upside follow-through, it strengthens the case for a developing bullish shift if buyers can continue to build on Wednesday’s reversal.
200-Day Line Caps Near-Term Recovery
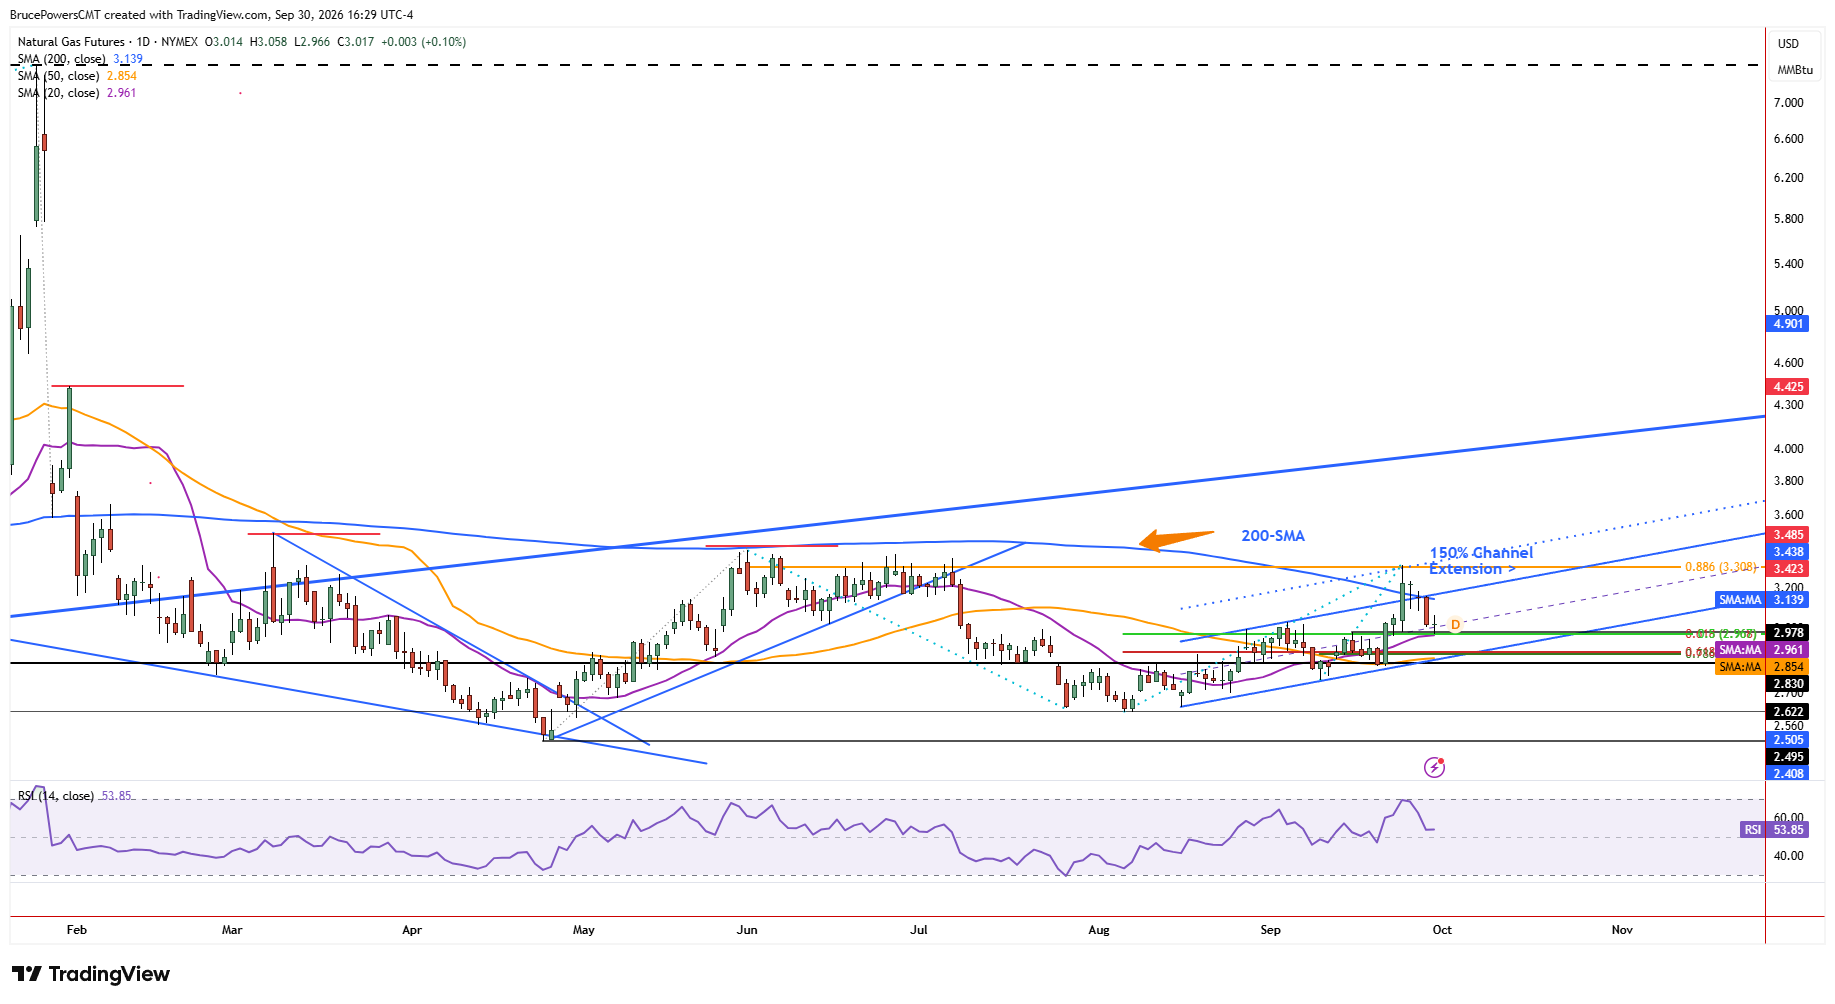
Key resistance was recently identified near the 200-day moving average and the upper boundary of an initial rising channel. A decisive rally above Tuesday’s high of $3.156 would therefore show strength and increase the possibility of a fuller recovery. This level can serve as a rough proxy for the resistance zone. However, Monday’s high of $3.18 provides a more definitive level since it is clearly above both the 200-day moving average and channel boundary, while the average carries greater significance as a longer-term technical reference.
June High Still Guards Larger Trend Shift
A sustained reclaim of the 200-day moving average, now near $3.14, could lead to a challenge of resistance near last week’s peak of $3.317 or the June high of $3.396. If the June high is exceeded decisively, a bullish reversal signal for the larger declining trend structure would trigger. That would open the possibility of further upside for natural gas. Otherwise, resistance in the zone from around $3.32 to $3.40 may hold, potentially leading to renewed selling pressure. Therefore, Wednesday’s reversal is constructive, but sustained strength above the key resistance levels remains necessary to confirm that a larger recovery may be developing.
If you’d like to know more about how to trade natural gas, please visit our educational area.


