Weekly Close Confirms August Breakout
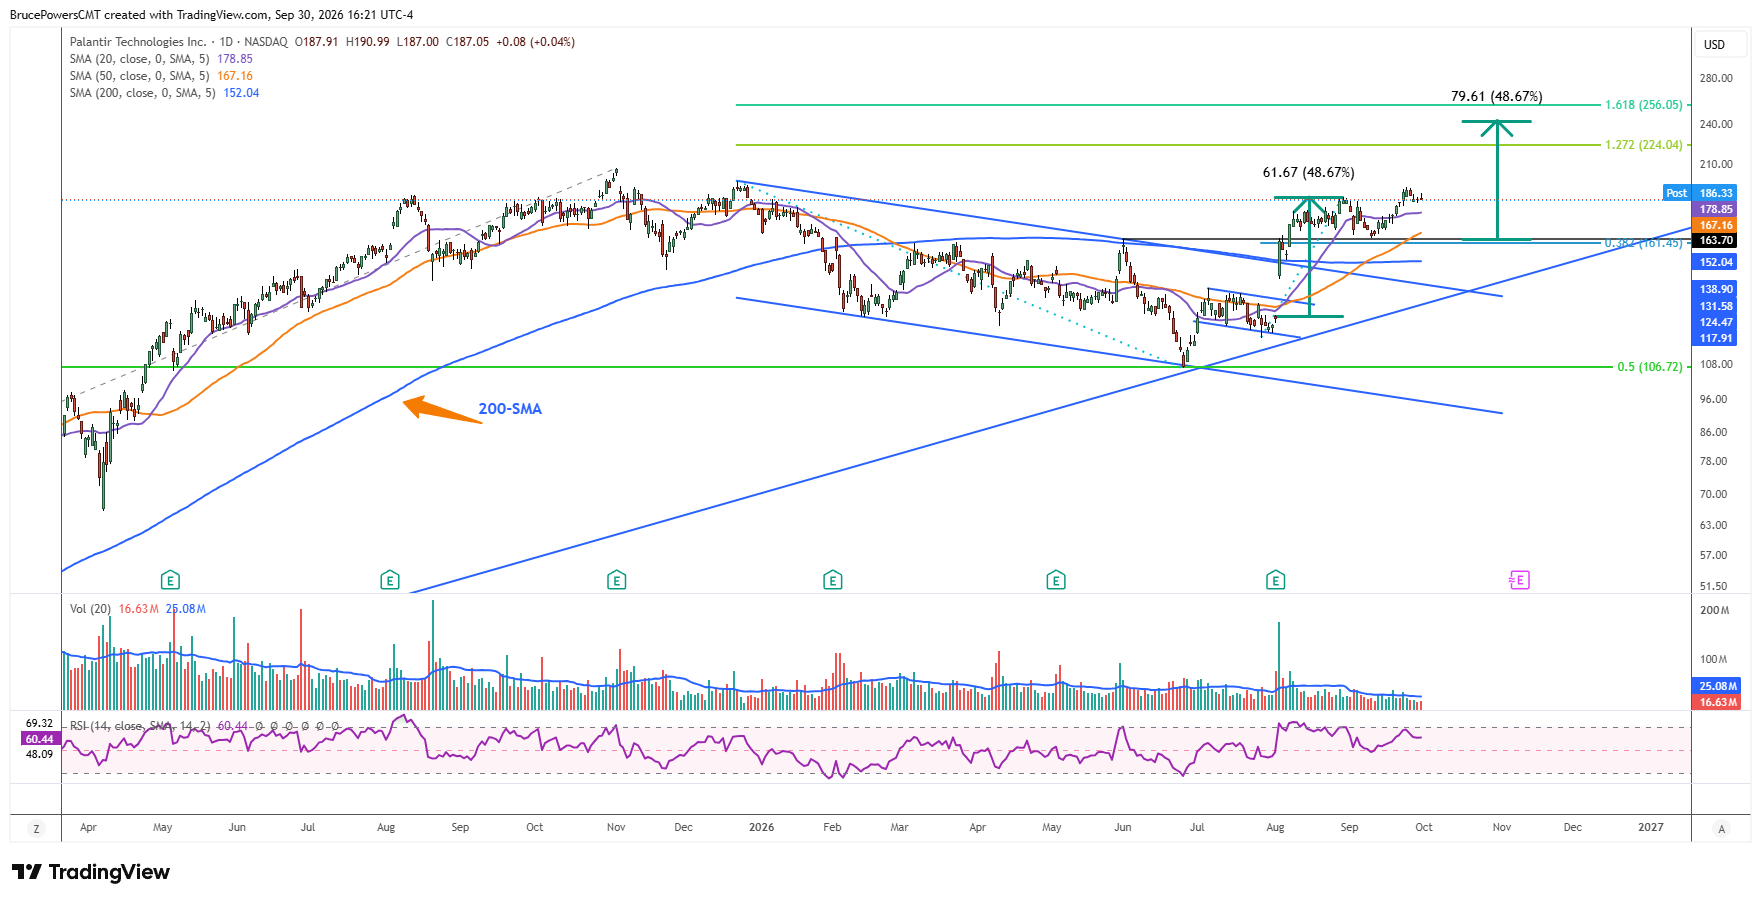
Last week Palantir Technologies (PLTR) triggered a continuation of its short-term bullish trend with a rally above the prior high of $188.37 from August. A new high of $194.68 was reached, and the breakout was confirmed on the weekly timeframe by a weekly close above the breakout level. This is bullish price action that suggests the potential for further upside. It also indicates the completion of a two-week pullback that found support near prior structural resistance at the lower swing high of $163.70.

Shallow Retracement Flags Persistent Demand
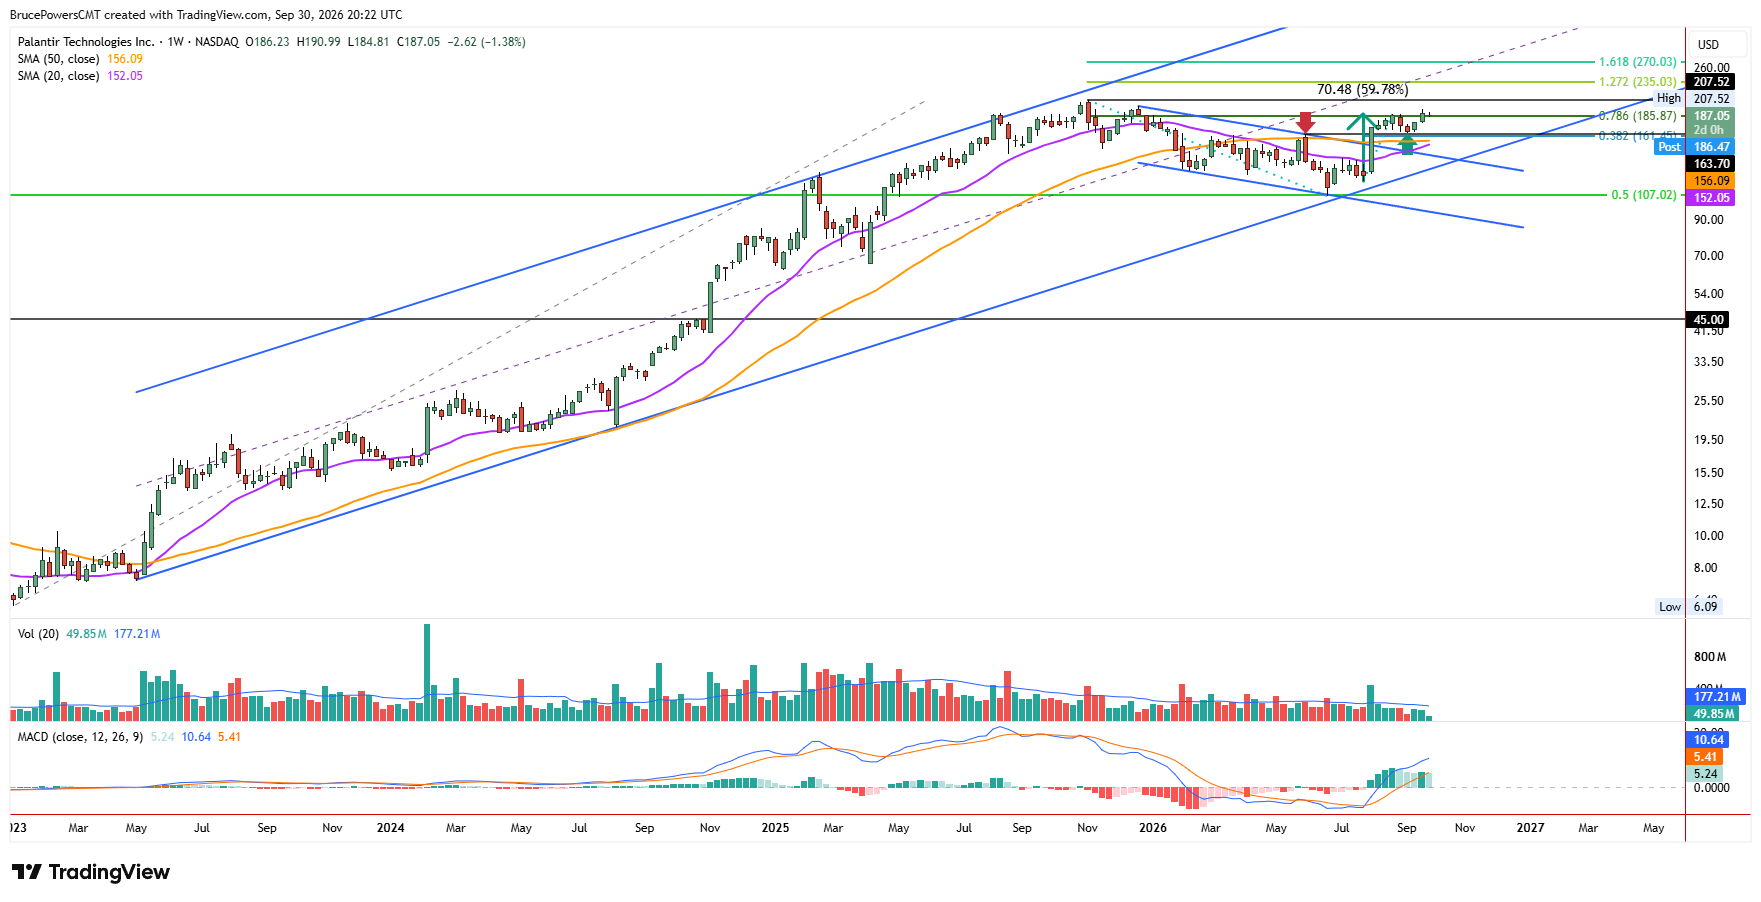
The recent pullback established support at $164.55, a little shy of a 38.2% Fibonacci retracement of the prior advance at $161.45. That shows strong underlying demand, which was reinforced with last week’s breakout. What makes PLTR interesting is the sharp advance that preceded the $188.37 high. PLTR gained around 59.8% from the higher swing low in July to the August high. That prior run is why decisive buying could once again drive PLTR up sharply now that the correction appears to be completing.
Stall From $169 Low Still Fits Structure
Although strong bullish momentum has not yet followed last week’s breakout, the latest advance began from the recent swing low near $169. It is therefore not too much of a surprise that the trend couldn’t sustain itself into new highs before stalling and consolidating short-term. However, following a pullback or further consolidation, the larger developing trend structure still suggests an eventual continuation higher.
$176 Weekly Low Defines Bull Case
The potential bullish scenario for PLTR remains if short-term support at last week’s higher weekly low of $176.76 holds. The 20-day moving average is also showing dynamic support near $178.85 and can offer a guide. A decline below the weekly low removes the pattern of higher weekly lows and suggests lower prices may be tested as support.
Measured Move Opens $207 Then $242
A measured move projection suggests the potential of new highs towards approximately $242 if buyers can regain control. The prior peak of $207.52 is the first upside target. Two Fibonacci extensions of the recent decline suggest potential resistance at $224.04 for the 127.2% level and $256.05 for the 161.8% level. Those targets remain valid if last week’s breakout holds and $176.76 stays a higher weekly low.
If you’d like to know more about technical analysis and how traders use it, please visit our educational area.