
Nasdaq Is Leading Stocks Into Month-End on Softer PCE
The Nasdaq Composite Index is out in front Wednesday as stocks push higher into the last few hours of September. Softer inflation took some of the urgency out of the October rate-hike trade. Buyers went straight back to software and the megacap growth names, pulling the index back into its retracement zone.
The S&P 500 Index is up too, in a narrower move. The bond market isn’t signing off on a full risk-on day with yields still sitting near their highs. Friday’s jobs report is also still out there, facing a market that cut its October hike bets without letting go of December.
At 17:51 GMT, the Nasdaq Composite Index is trading at 27,025.60, up 228.06 points or +0.85%. The S&P 500 Index is trading at 7,708.16, up 37.32 points or +0.49%.

Core PCE Sent the October Hike Odds Sliding
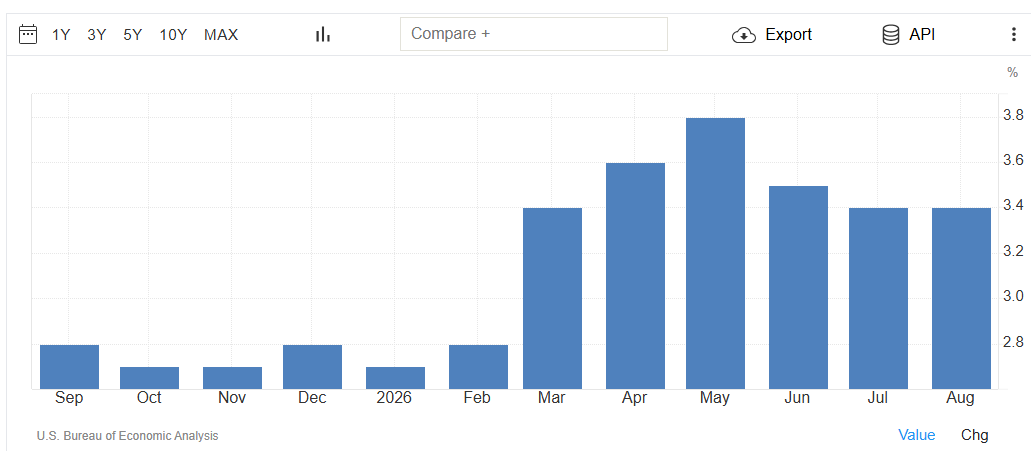
Core PCE came in soft enough to shake the October hike trade loose. The August core price index rose 3.0% from a year earlier. The forecast was 3.3%, matching July’s pace. Headline slowed to 3.4% from 3.7%, also under expectations.

CME FedWatch had the odds of an October quarter-point hike near 35%. They were above 50% on Tuesday. Earlier in the week they sat around 70%. That’s a lot of air coming out of the October hike trade in a few days.
The hike cycle is still very much alive in the pricing, though. December is still priced for another increase, with longer-term pricing leaving room beyond that. New York Fed President John Williams cooled things off Tuesday, saying policymakers have time to gather more information. Wednesday’s inflation data gave him cover.
Dow Jones Price Forecast
Every new Dow Jones analysis as it publishes, today's technical signal and key levels, live price — on one page.
See all Dow Jones forecastsThe Long End Is Why This Rally Isn’t Running
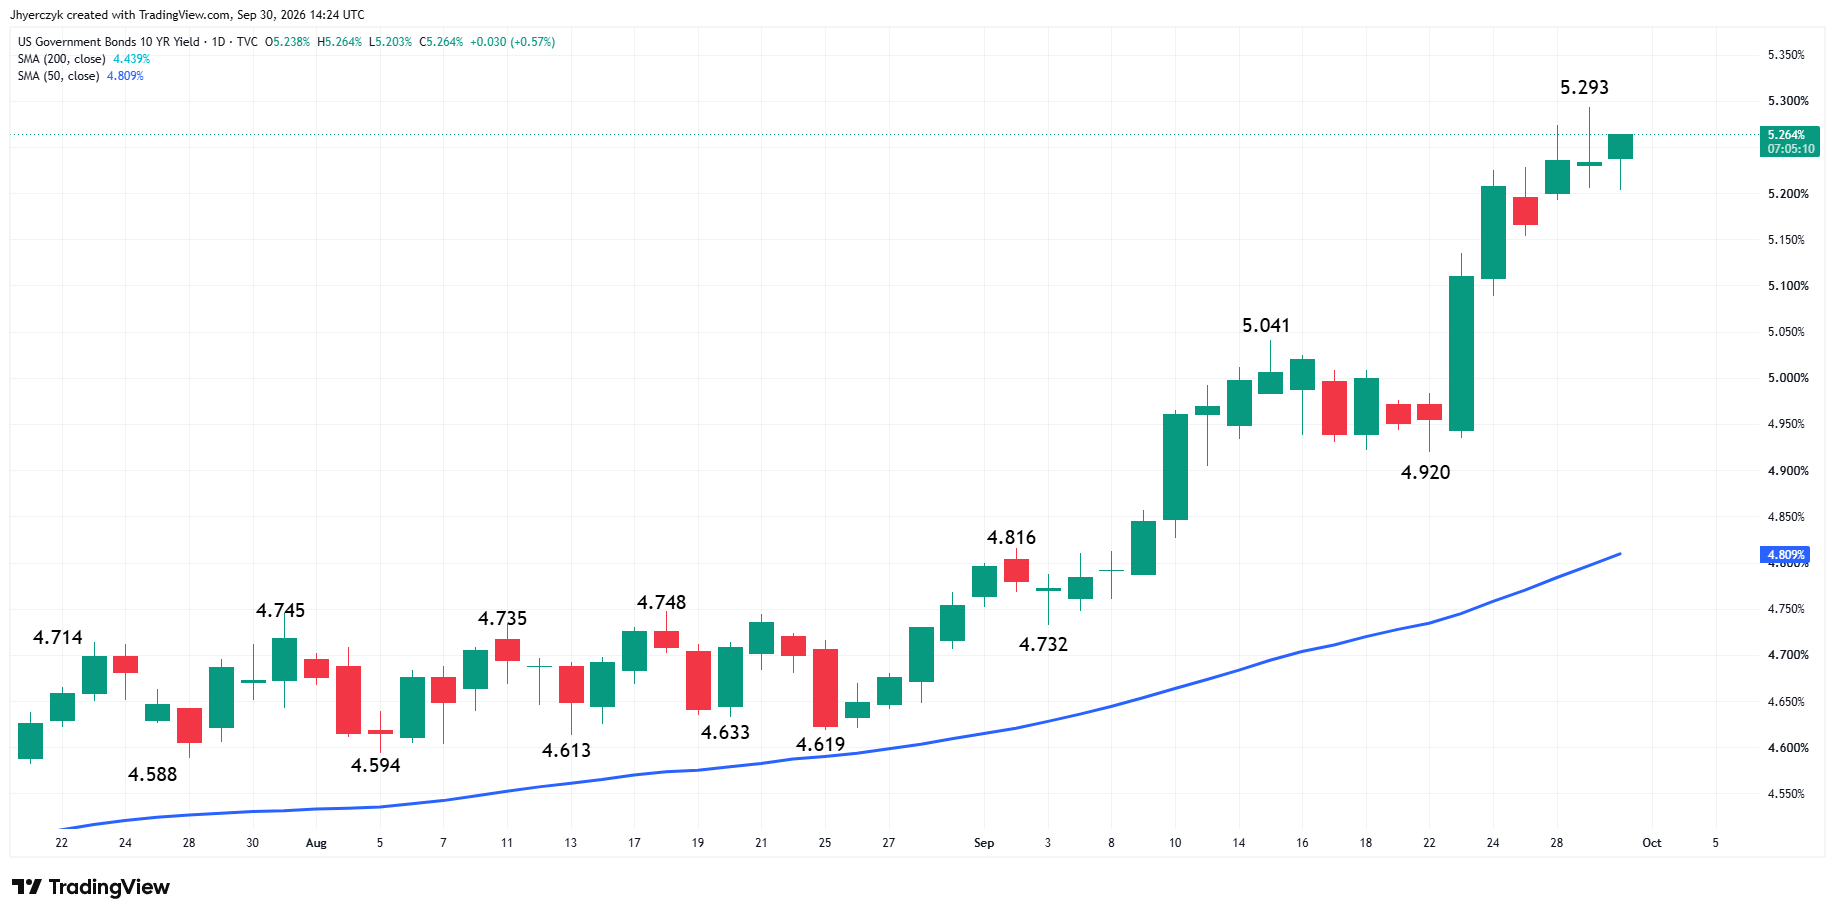
Stocks got a rate rally that stopped short. The 10-Year U.S. Treasury yield was near 5.27% Wednesday, within reach of Tuesday’s high, which put it close to its 2007 peak. Stock buyers aren’t getting much of a tailwind out of that. The 30-Year was near 5.62%, still hanging around levels last seen in 2002.
The softer inflation number didn’t change the growth picture. Second-quarter GDP was revised higher. The Atlanta Fed’s third-quarter estimate is still firm. ADP had private employers adding 90,000 jobs in September against a 68,000 estimate.
Bond traders are staring at resilient growth, inflation still running above the Fed’s target and a heavy slate of Treasury supply. The long end carries its own risk, whatever October does.
Friday’s Non-Farm Payrolls report is the next test. Economists are looking for 84,000 jobs in September. The stock rally needs that number to cooperate with the bond market.
Software Is Doing the Lifting While Chips Sit It Out
Software and the megacap growth names are doing the heavy lifting. Alphabet, Amazon and Apple are higher. Palo Alto Networks, Microsoft and Intuit are out front in software.
The chip stocks aren’t going along. AMD and Broadcom are lower, even after Bank of America said the fourth and first quarters have historically been the two strongest seasonal stretches for semiconductor outperformance. That leaves the Nasdaq leaning on a narrow group, without the broad AI participation buyers want to see.
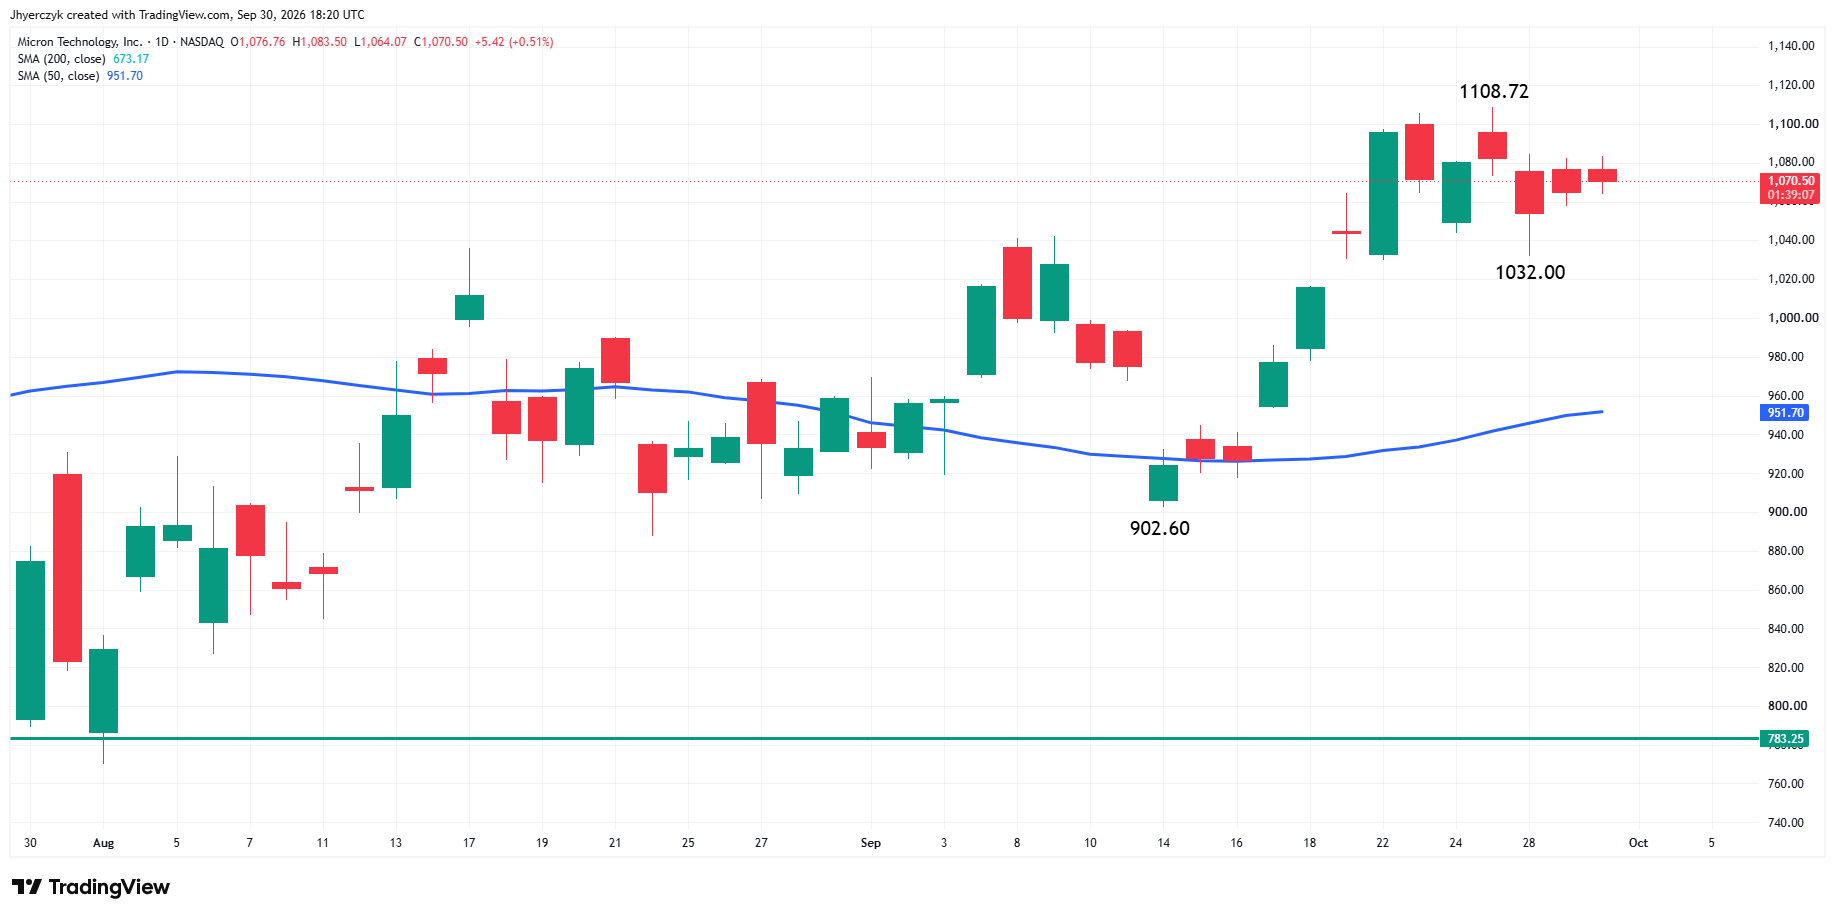
Micron reports after the close. That’s the next real test for the chip group. Right now Wednesday’s Nasdaq advance reads like a megacap and software rally, and Micron is the chip stocks’ chance to change that.
The Oil Premium Is the Part PCE Didn’t Touch
Crude is higher again in September. That’s despite signs that Saudi export loadings through Yanbu are improving after damage to the East-West Pipeline. Brent is near $104 per barrel, with U.S. crude above $91.
The Middle East supply premium hasn’t come out. PCE eased the immediate inflation worry for stocks. It didn’t take away the oil risk. It didn’t take the pressure off the long end of the Treasury curve either.
Daily Nasdaq Composite Index Technical Analysis
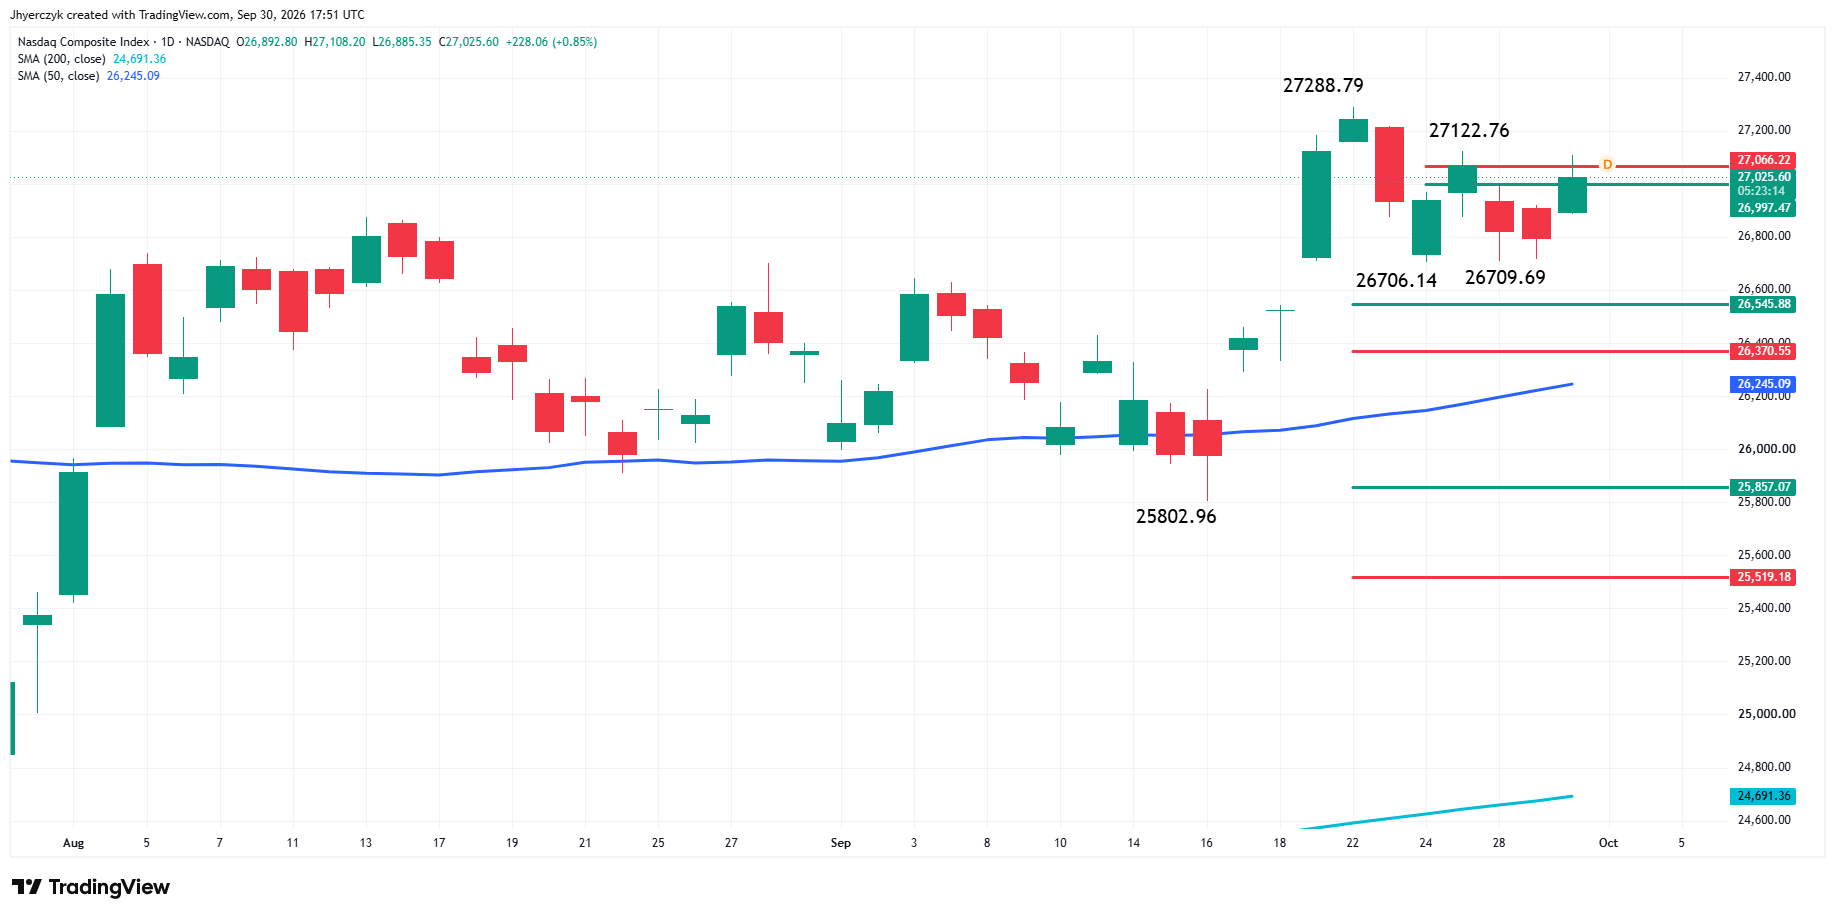
The main trend is up according to the daily swing chart. A trade through the September high at 27,288.79 will signal a resumption of the uptrend. The main trend will change to down if 25,802.96 fails.
The minor trend is also up. A trade through 26,706.14 will change the minor trend to down.
The Nasdaq Composite Index recovered into the 26,997.47 to 27,066.22 retracement zone Wednesday after trading below it earlier in the week. The next support zone is 26,545.88 to 26,370.55, with the 50-day moving average at 26,245.09 underneath.
Daily S&P 500 Index Technical Analysis
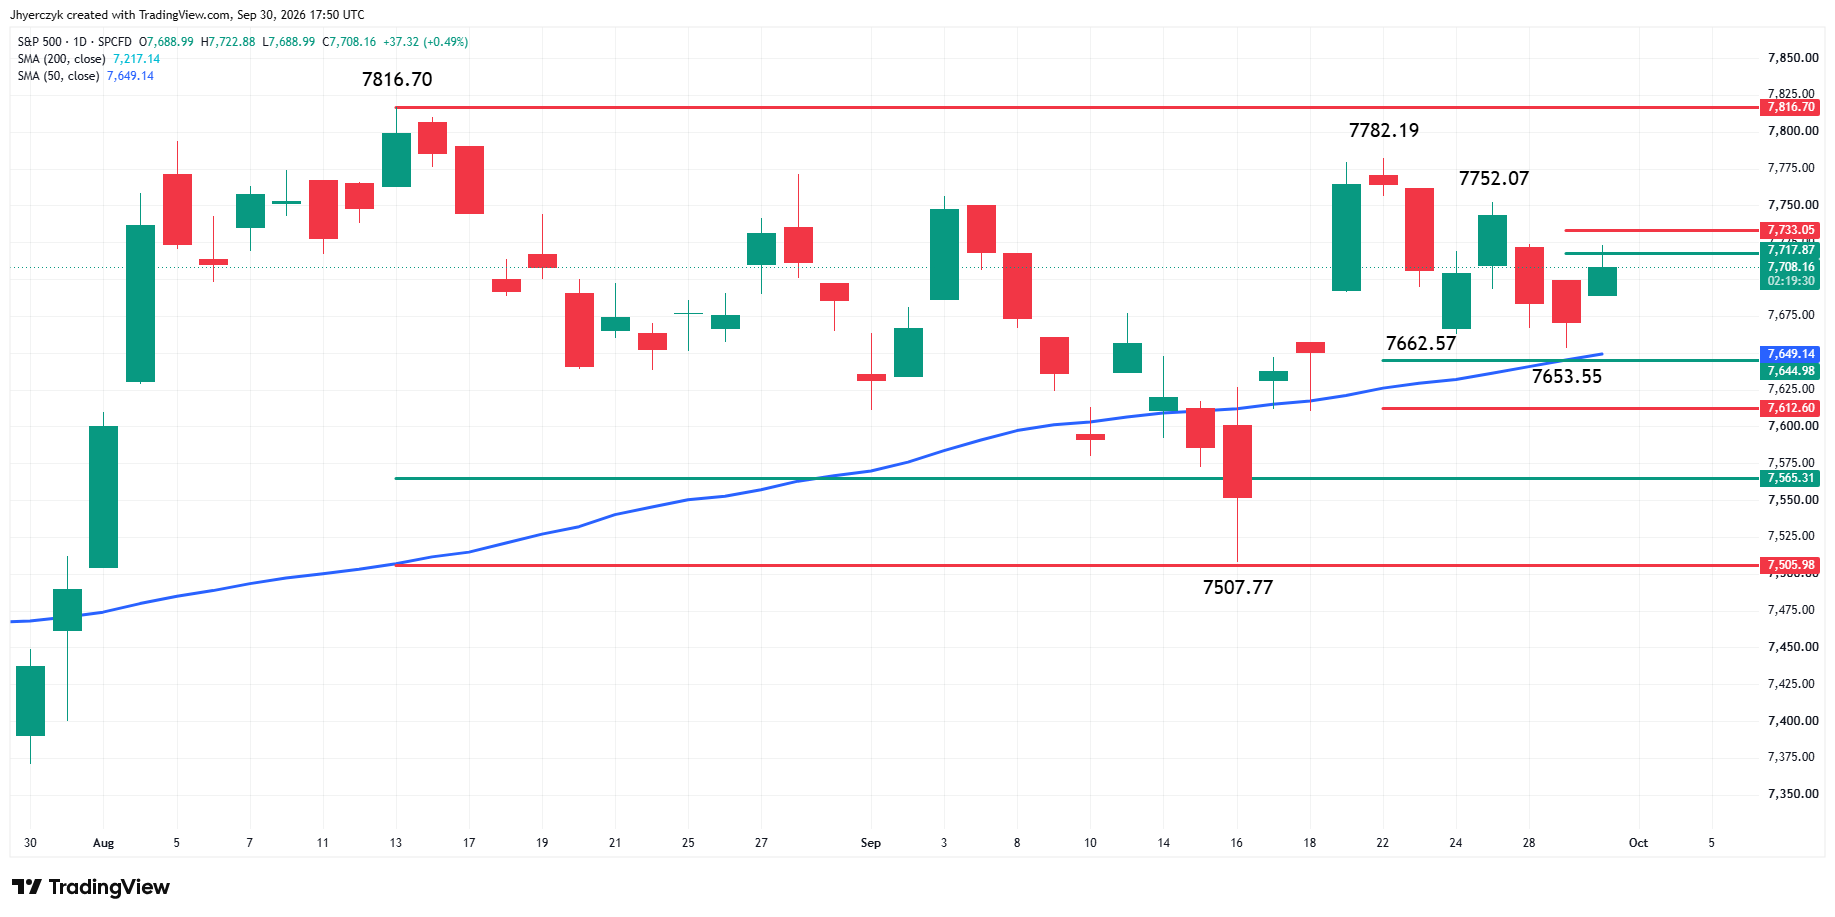
The main trend is up according to the daily swing chart. A trade through the record high at 7,816.70 will signal a resumption of the uptrend.
The minor trend is down. A trade through the lower top at 7,752.07 will change the minor trend to up and shift momentum higher.
The S&P 500 Index is recovering from its short-term pullback, however, it remains below the 7,717.87 to 7,733.05 resistance area. Buyers need to take offers through that zone before the September highs at 7,752.07 and 7,782.19 come back into play.
The first support is the recent bottom at 7,653.55. The 50-day moving average at 7,649.14 is nearby, making the 7,653.55 to 7,649.14 area important on the downside. A sustained move under it could put 7,612.60 in front of the market.
What to Watch
Friday’s jobs report is the next broad-market catalyst, however, Wednesday isn’t done. Fed speakers are on the calendar later in the session. Micron reports after the close. Any oil headline can put inflation right back on the screen. Stocks have three chances at a reaction before Friday even gets here.
The bias leans higher. The Nasdaq Composite Index pushed back into its retracement zone after trading under it earlier in the week, and it was holding inside the zone at 17:51 GMT. Traders are watching whether buyers can take out the upper boundary at 27,066.22 and hold the move.
The main trend is up on both daily swing charts, but the S&P 500 Index has a minor downtrend working against it. It was still under resistance at 7,717.87 to 7,733.05 at 17:51 GMT, with the 50-day moving average at 7,649.14 underneath.
More Information in our Economic Calendar.