AI Infrastructure Rally Enters Consolidation
Astera Labs, Inc. (ALAB), a semiconductor connectivity company that provides high-speed connectivity solutions for cloud and AI infrastructure, has been consolidating in a relatively tight range for seven days and is potentially setting up a continuation of a sharp five-day rally of over 46% that preceded it. The developing pattern has characteristics of a high tight flag pattern, as ALAB continues to test resistance near the lower swing high of $367.85 from August.
Strong demand during the recent rally, including the reclaiming of both the 20-day and 50-day moving averages, supports the potential for an eventual upside resolution. However, the pattern is relatively small and may need more time to consolidate and further define itself.

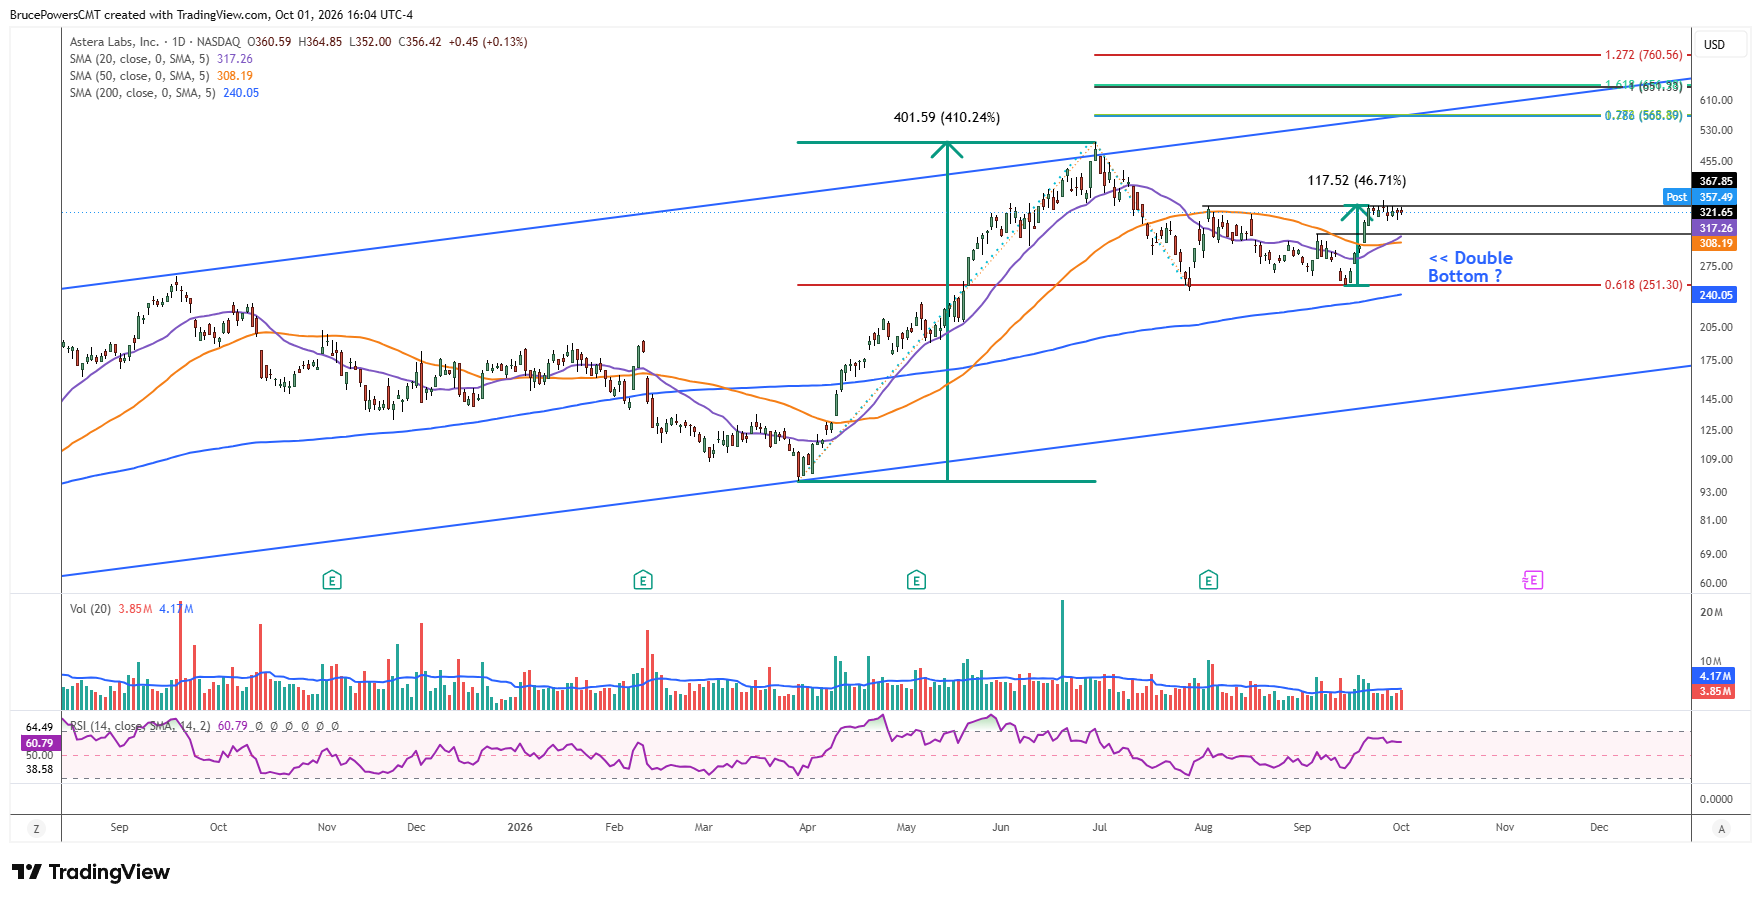
Double-Bottom Setup Takes Shape
The sharp rally began following a new swing low of $251.63 a couple weeks ago, which further confirmed support near the 61.8% Fibonacci retracement of the prior advance. It also formed the second bottom for a potential double bottom pattern. A decisive breakout of that pattern would signal a reversal of the prior decline and indicate that the bearish correction that followed the $499.48 peak in June may be complete. That potential reversal would also strengthen the case that a new longer-term upswing is developing.
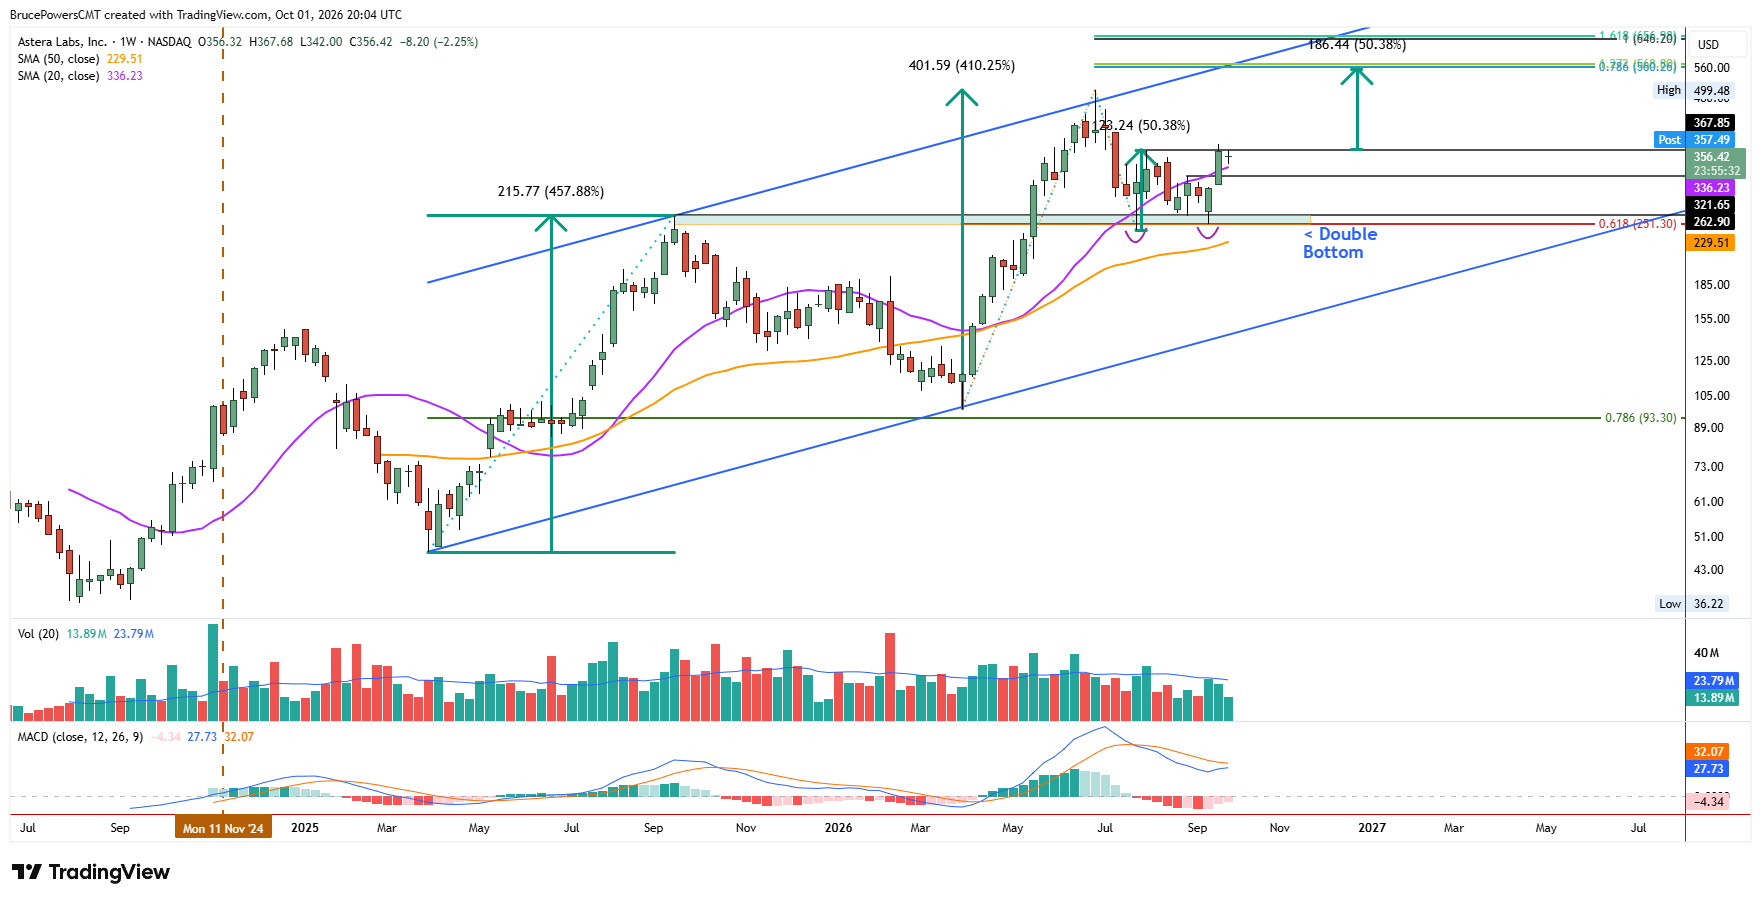
$377.87 Breakout Becomes Key Trigger
A sustained breakout above last Friday’s high of $377.87 would therefore signal a breakout from both the double bottom pattern and the short-term consolidation, confirming an extension of the uptrend that began from the second bottom. The previous two long-term upswings in ALAB ended after the stock gained around 410% and approximately 457%, respectively. While those prior advances do not guarantee a similar move, they demonstrate the magnitude of previous sustained upswings in the stock. The weekly chart also provides an important reference level, with this week’s resistance currently at $367.68.
Higher Targets Come Into View
Following a successful upside breakout, the prior high becomes the first major upside target, followed by two confluence zones defined by Fibonacci extensions and measured-move projections. The two upside resistance zones that stand out are near $565, followed by $651. These levels could become important areas to monitor if the new upswing develops.
Support Levels Define Downside Risk
On the downside, if a deeper pullback follows, key potential support areas include the lower swing high of $321.65 and the 20-day and 50-day moving averages, currently near $317 and $308, respectively. For now, the tight consolidation keeps the focus on whether buyers can break resistance and confirm the next upswing.
If you’d like to know more about technical analysis and how traders use it, please visit our educational area.