


Support Zone Faces Renewed Pressure
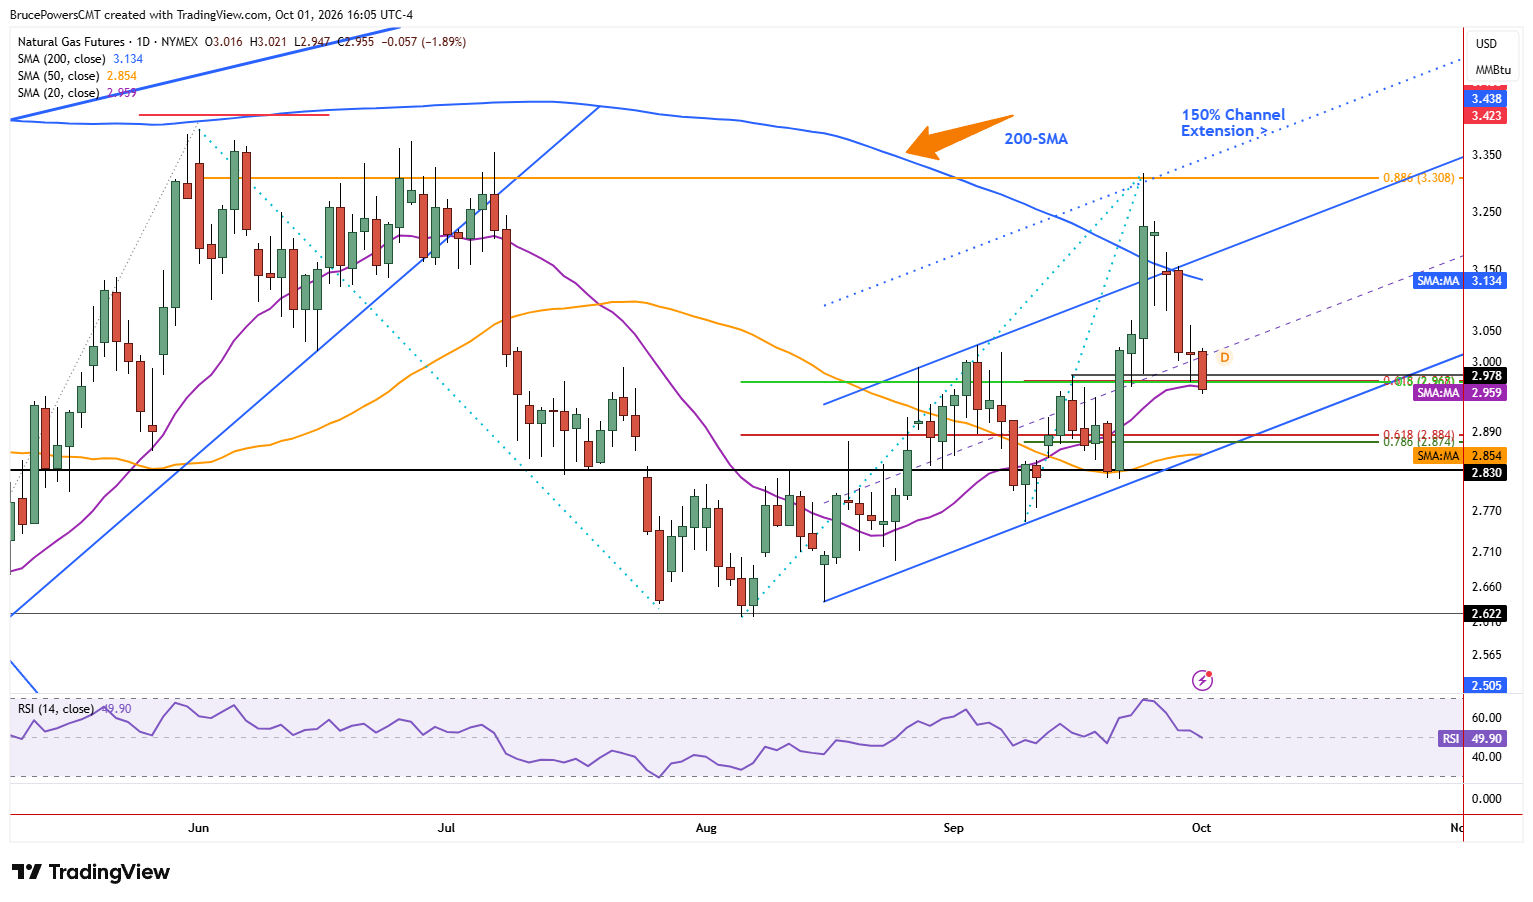
Natural gas remained under selling pressure on Thursday, falling to a new retracement low of $2.948 and testing a key support zone more deeply. The 20-day moving average near $2.96 marks the lower boundary of the support zone that developed around the interim swing high of $2.978 from mid-September. That range was undercut briefly during Thursday’s session and remains vulnerable to a breakdown. A daily close below Wednesday’s low of $2.966 would increase the risk of further weakness.

Momentum Hangs on Buyer Response
Nonetheless, unless a bearish continuation signal triggers below Thursday’s low, the potential for support to build at the current price zone remains. Although the 20-day moving average may be beginning to move out of consolidation, the current retracement is the second notable decline to test support at that indicator since it was reclaimed in August. As a result, the reaction to this test may provide an important indication of the balance between supply and demand. The prior two retracements eventually found support around the 20-day moving average, although neither produced a particularly precise reaction.
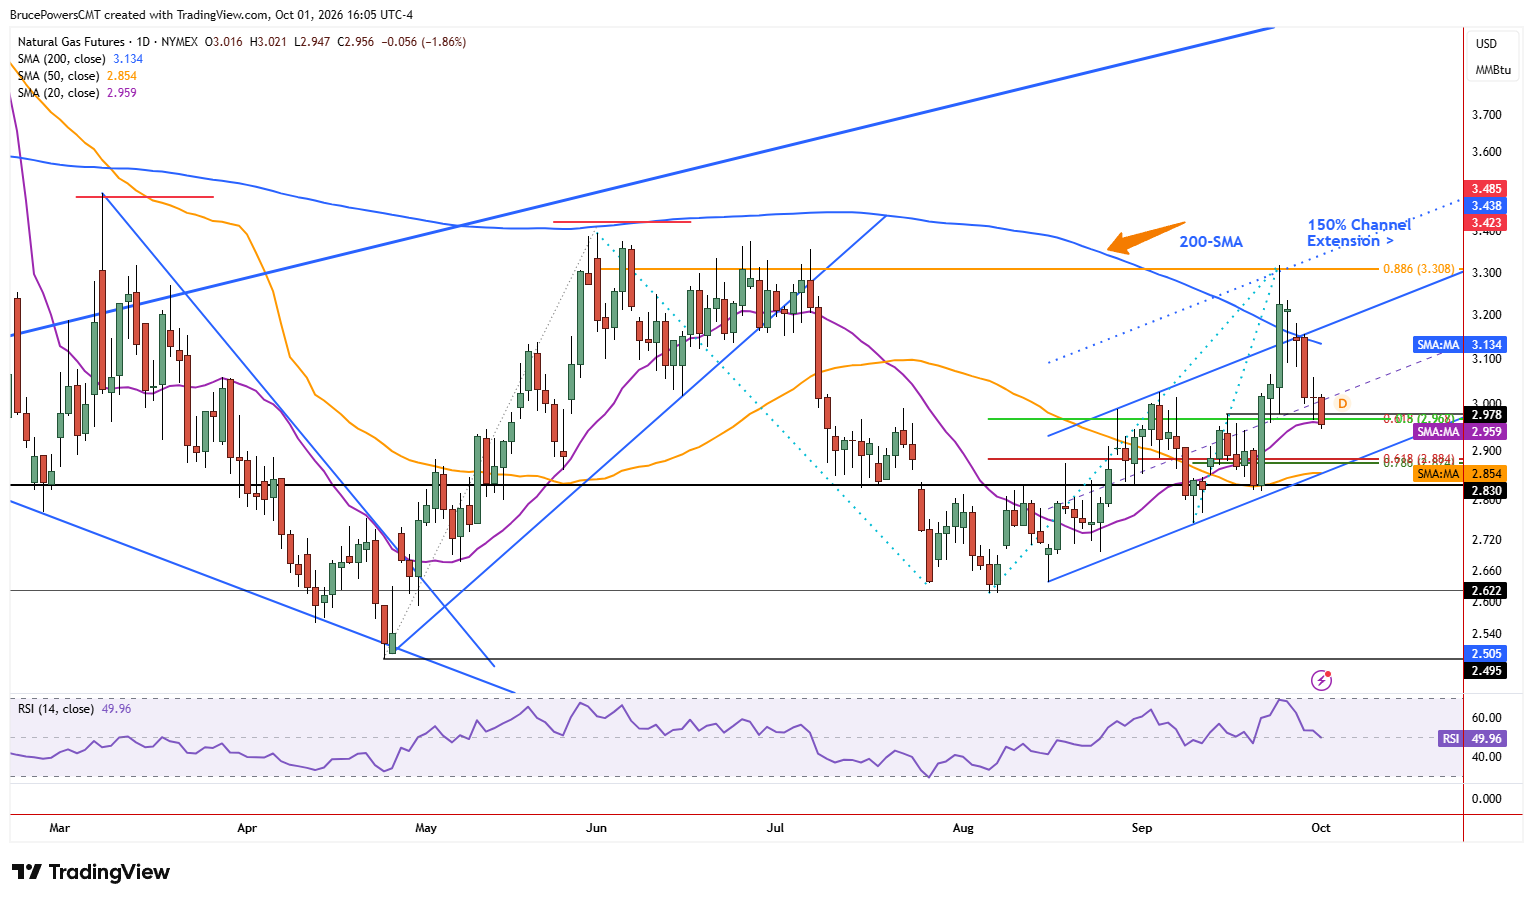
This latest test should therefore provide a clearer indication of near-term momentum. If support holds and leads to strength, it would suggest that bullish momentum is increasing. A higher swing low would also support a continuation of the more rapid gains that followed the recent interim swing low at $2.817. That low also established support at the 50-day moving average, which represents the intermediate trend. If buyers defend the 20-day moving average again, it would be a bullish sign that demand is strengthening and would reinforce the 20-day moving average as key dynamic support.
Lower Targets Emerge Below Thursday’s Low
If Thursday’s low is broken to the downside a bearish continuation signal will trigger, increasing the likelihood that support will be tested at the lower levels. Two Fibonacci retracement levels at $2.884 and $2.874 form the next lower potential support zone. Natural gas was also clearly rejected from resistance this week, with the 200-day moving average near $3.13 and the upper boundary of the rising trend channel reinforcing resistance. Therefore, the lower boundary of the channel becomes a potential downside target, supporting a test of the $2.88 area. For now, Thursday’s test of the 20-day moving average remains the key near-term indication of whether buyers can rebuild support or sellers can extend the retracement.


