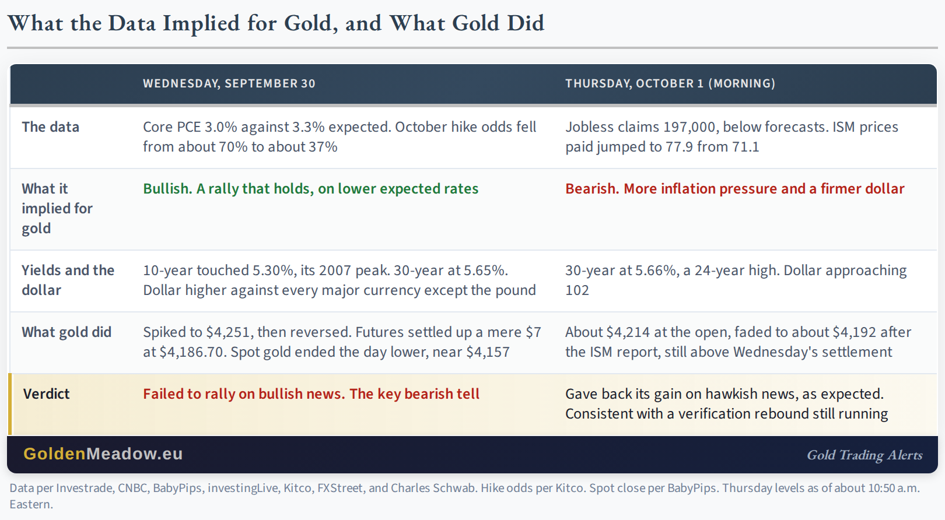
Wednesday brought a softer-than-expected inflation report. Core PCE rose 3.0 percent from a year earlier against 3.3 percent expected, and October hike odds fell from about 70 percent earlier in the week to about 37. That is bullish news for gold. A downside inflation surprise of that size and a halving of the odds of the next hike should have produced a rally that held.
It looks like the gold price forecast for October 2026 that I published yesterday is already being realized.
Gold jumped to $4,251 on the release and then gave it back as yields and the dollar recovered. The 10-year touched 5.30 percent, its 2007 peak, gold futures settled at $4,186.70, up a mere $7, and spot gold kept falling into the close, ending the day lower near $4,157. Gold failed to rally on bullish news, and that is the key information from this week.
This morning the news turned hawkish. Jobless claims fell to 197,000, the ISM’s prices-paid index jumped to 77.9 from 71.1, the USD Index moved toward 102, and the 30-year yield reached 5.66 percent, a 24-year high.
Gold opened about $28 higher near $4,214 and faded to about $4,192 after the ISM report. That is the reaction hawkish data should produce, and gold holding above Wednesday’s settlement with the dollar rising fits a verification rebound that is still running. It does not offset Wednesday.

What the Data Implied, and What Gold Did
Yesterday, I wrote: “Neither path in crude gives the metal what it needs, which is a dovish Fed and a weaker dollar.”
On Wednesday, gold got the first half of that, and it was not enough.
A softer Fed without a weaker dollar and lower long yields bought gold one morning. The front end of the curve eased on the PCE report, but the long end kept rising, and the dollar finished higher against every major currency except the pound.
When a market fails to rally on news that should lift it, the buyers who would drive that rally are not there, and that is the condition in which declines resume.
Gold Price Forecast
Every new Gold analysis as it publishes, today's technical signal and key levels, live price — on one page.
See all Gold forecastsOil Turned Up, and the Inflation Data Followed
Yesterday, I wrote: “Crude oil seems to have bottomed right in my target area.” And: “higher oil means hotter inflation data, higher yields, and a firmer dollar.”
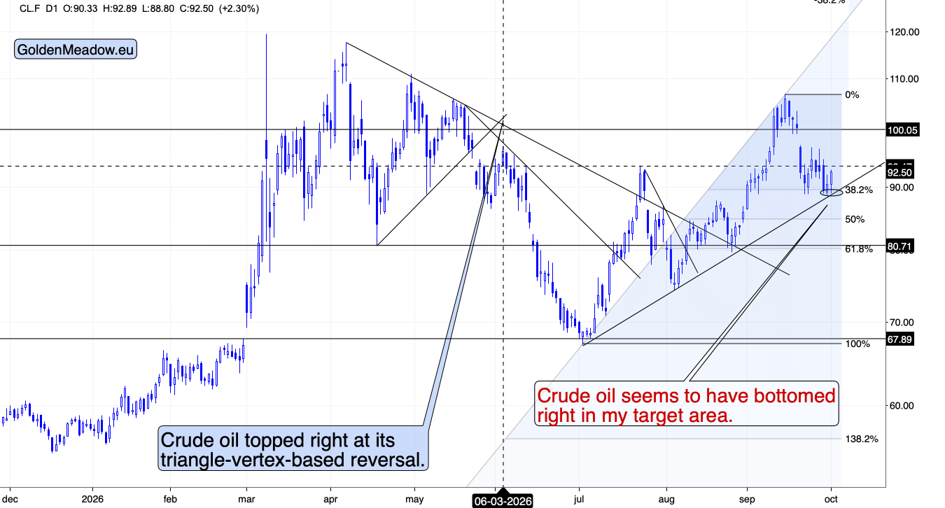
WTI settled Wednesday at $90.42, up $1.04, and is higher again today, above $92. The ISM’s prices-paid index rose 6.8 points to 77.9, the first inflation reading since crude bounced, and yields and the dollar both rose with it.
Gold: The Rebound Was Sold
On Tuesday, I wrote that “a rebound to the $4,275 or so (or lower) would be rather normal, and not a reason to be concerned.” The October sequence has three stages: that verification rebound, a move toward the first target near $3,920, and the larger slide.
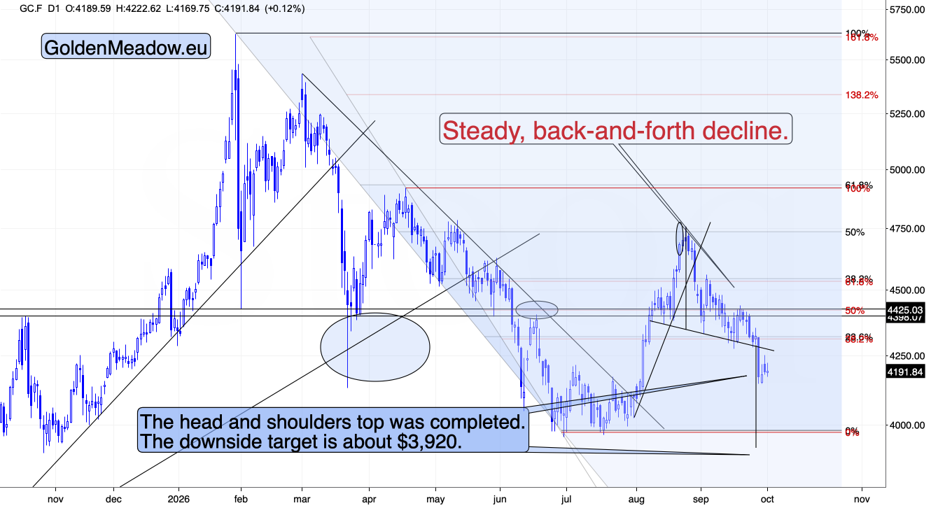
Gold is in the first stage. Wednesday’s high at $4,251.20 fits the “or lower” part of the rebound, and it was sold the same afternoon. Today’s attempt reached about $4,214 before the ISM report and faded. Whether the rebound has finished is for the chart to show. What these two sessions were not is a reversal: gold rallied on a softer-than-expected inflation report and failed to hold the gain.
Right after gold broke below the neck level of the head-and-shoulders pattern – on Sep. 29 – I wrote the following:
Now, I know that we all got happy with metals’ yesterday’s decline, but I have to be objective here (and always). The completed head-and-shoulders patterns are quite often followed by some sort of verification.
This verification already happened. Right now the situation is more bearish than it was right after the breakdown. And we are positioned to take advantage of it.
Silver
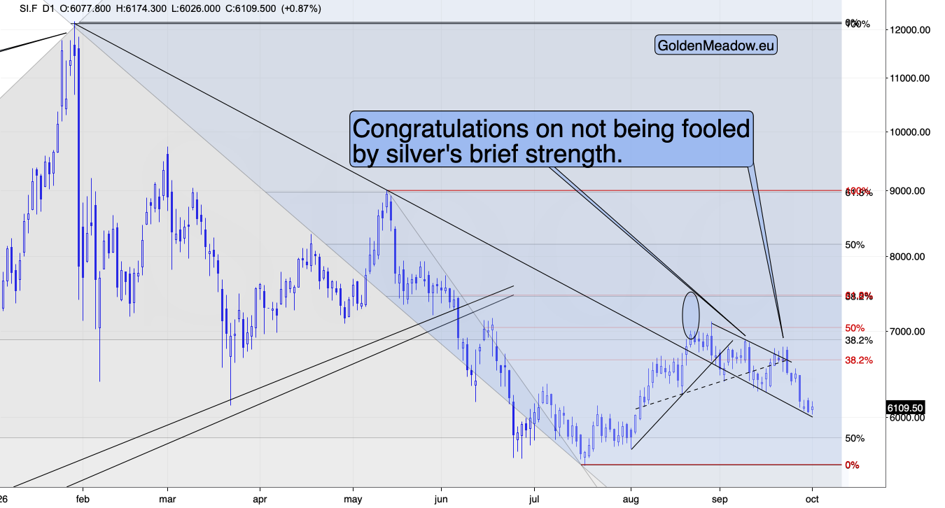
Silver price settled Wednesday at $60.57, down $0.59, its third straight lower settlement. This morning, it is up more than gold, the outperformance that has marked every short-term top since Labor Day.
The next sizable move is likely to be to the downside. Remember how strong silver was when it pierced through $100 and how excited everyone got (and yet, we took profits from the long-term silver investments above $100)? This is no longer the case as the size of the August rally wasn’t nearly as impressive as the rallies that we saw in gold and miners.
Gold Mining Stocks
I previously wrote: “The neckline near $117 is where a verification rebound would run into resistance, and the H&S-based target is a bit below $100”. I first marked that neckline on Tuesday.
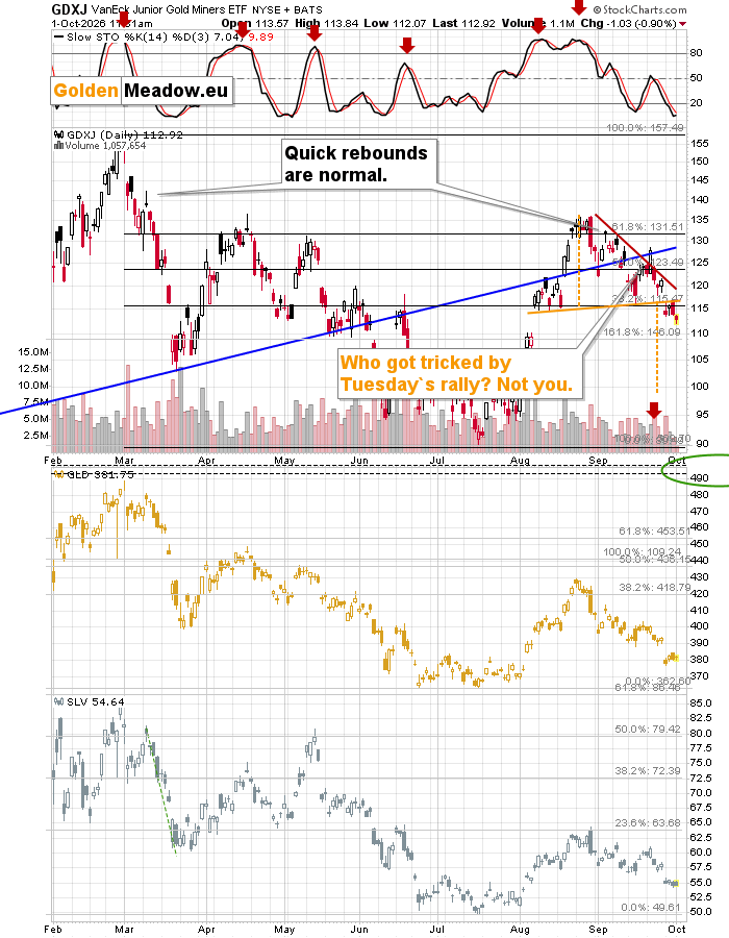
The GDXJ rallied to about $116.70 on Wednesday morning, mere $0.30 below the neckline, and turned lower from there, closing at $113.95, down 1.6 percent. The verification rebound ran into the resistance I had named and failed below it. It also failed on a day when the inflation data was bullish, and gold futures settled higher: the miners lost 1.6 percent while gold gained 0.2 percent. Miners falling while gold rises is the weakness that marks declines, not bottoms, and the target a bit below $100 remains the next stop.
The Dollar
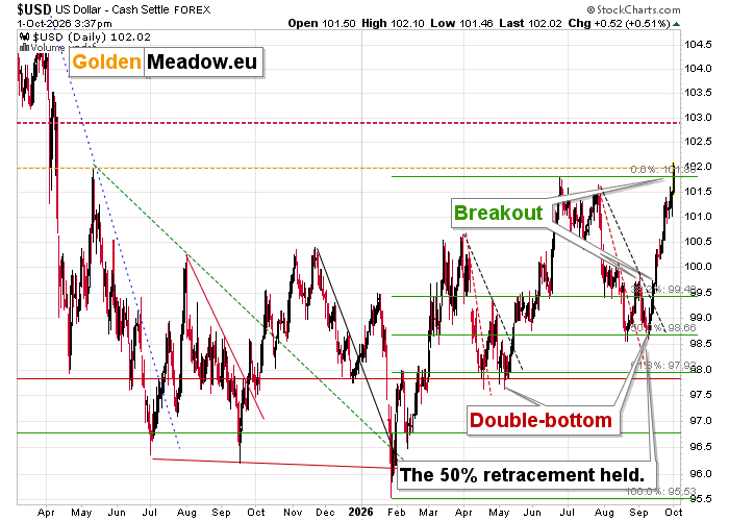
This might be huge.
I previously wrote that a pullback to 100.5 “would be normal from here and would fit the verification rebound in the metals.” The pullback was smaller and relatively quick – it showed just how strong the USD Index is right now.
The USD Index didn’t just break to new 2026 highs. It also broke above its May 2025 high. If this breakout is confirmed, it opens the door wide open to much higher levels. Just as the long-term chart has been indicating for a long time (and in tune with what I’ve been writing).
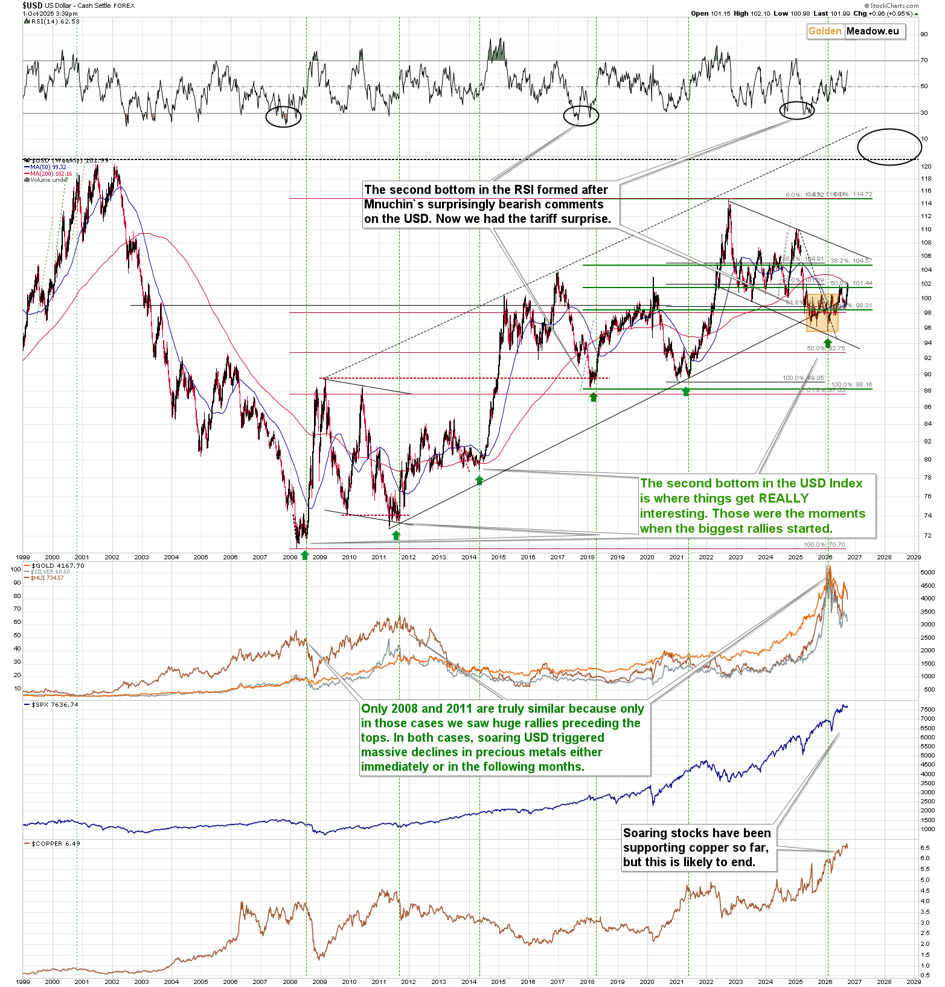
From the medium-term point of view, this rally is still tiny. It has a lot of room to run.
Most importantly, though, the broad bottom that started last year seems to be complete. The previous bottoms of this kind were followed by huge rallies – note what happened after bottoms that I marked with green arrows.
Of course, a major rally from here (which I fully expect to see), would have devastating effects on multiple markets, including precious metals and most commodities (crude oil being an exception).
Where This Leaves Us
My outlook and positions are unchanged, and the profit-take levels remain in place. I might need to adjust them soon given gold’s recent volatility, though.
Gold got a softer inflation print and a halving of October hike odds, news that should have produced a lasting rally, and the rebound reached $4,251 and was sold within hours. Oil has turned up from my target area, the ISM’s price index followed, and the dollar is testing its 2026 highs.
Gold kept the softer Fed for one morning. The dollar has kept its gains into Thursday.
Thank you for reading today’s analysis – I appreciate that you took the time to dig deeper and that you read the entire piece. If you’d like to get more (and extra details not available to 99% investors), I invite you to stay updated with our free analyses – sign up for our free gold newsletter now.
Thank you.
Sincerely,
Przemysław K. Radomski, CFA