
U.S. Dollar Tests New Highs
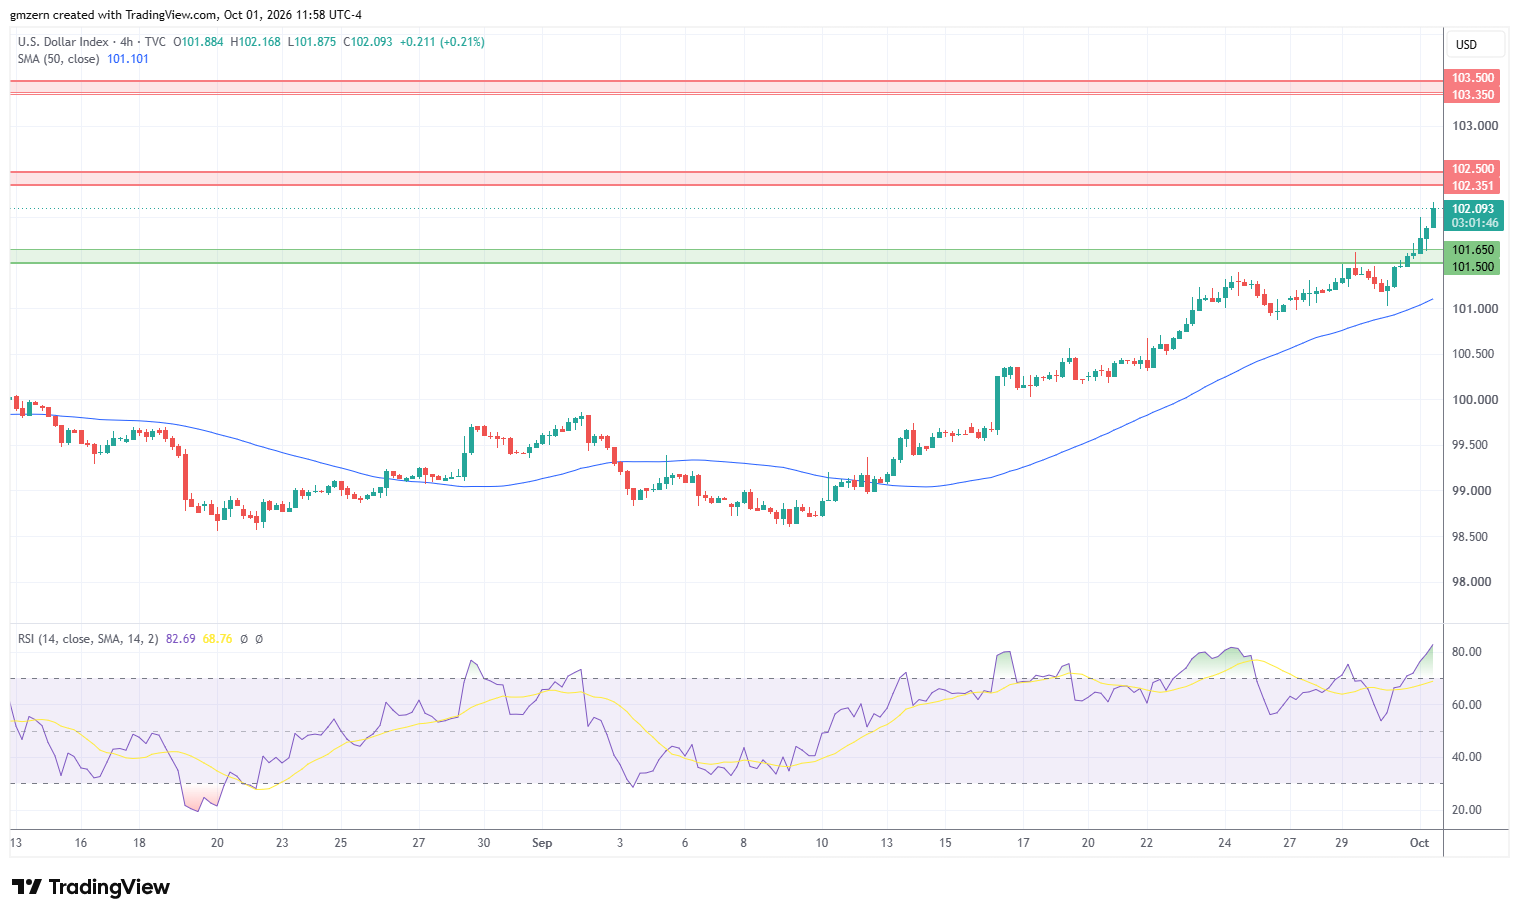
U.S. Dollar Index rallied as traders focused on ISM Manufacturing PMI report. The report indicated that ISM Manufacturing PMI decreased from 54.6 in August to 54.5 in September, compared to analyst forecast of 55. Numbers above 50 show expansion. The report missed analyst expectations but showed that U.S. economy remained in great shape, which was bullish for the American currency.
Traders also focused on the Initial Jobless Claims report. The report showed that 197,000 Americans filed for unemployment benefits in a week, compared to analyst consensus of 200,000.
The nearest resistance level for U.S. Dollar Index is located in the 102.35 – 102.50 range. If U.S. Dollar Index manages to settle above the 102.50 level, it will head towards the next resistance, which is located in the 103.35 – 103.50 range.

EUR/USD Is Under Strong Pressure
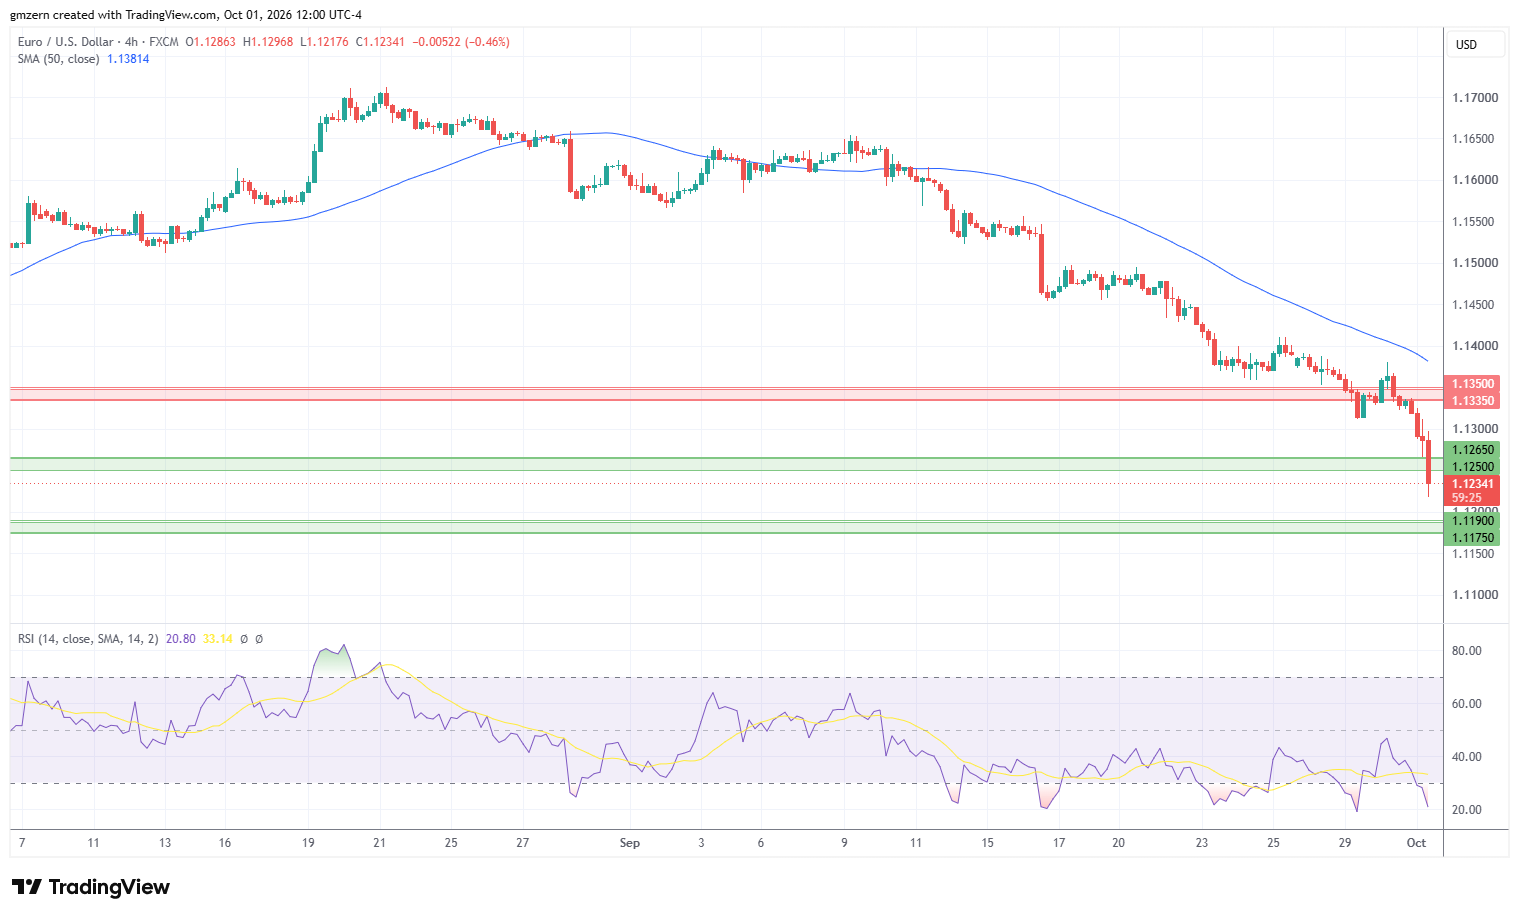
EUR/USD tests new lows as traders react to U.S. economic data and focus on the Euro Area Unemployment Rate report. The report showed that Euro Area Unemployment Rate remained unchanged at 6.4% in August, in line with analyst estimates.
Currently, EUR/USD is trying to settle below the support at 1.1250 – 1.1265. If EUR/USD manages to settle below the 1.1250 level, it will head towards the next support at 1.1175 – 1.1190.
GBP/USD Attempts To Settle Below 1.3200
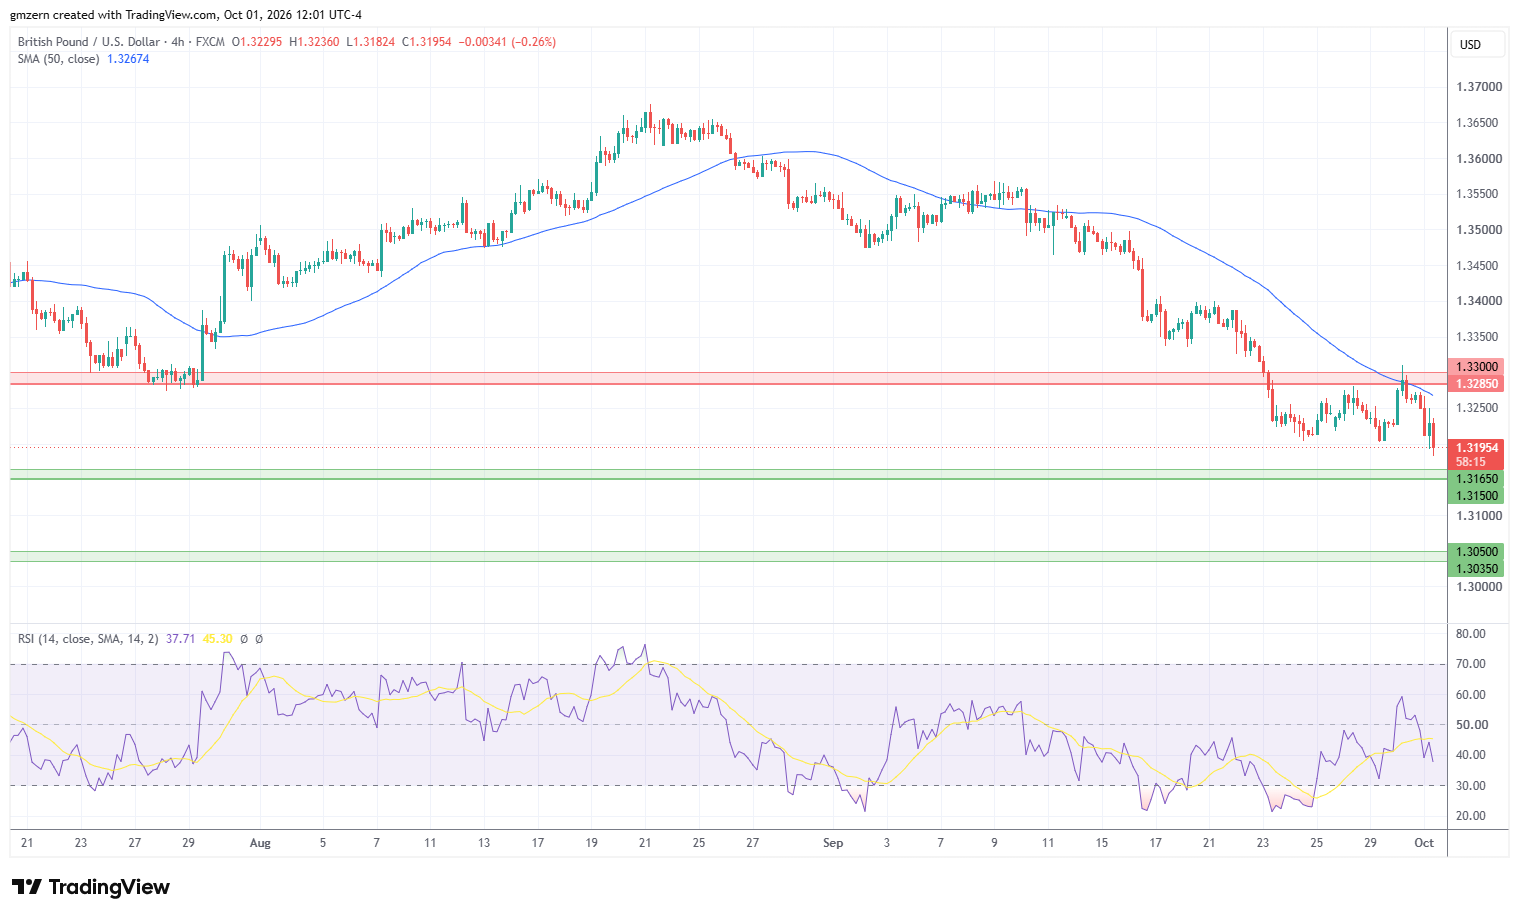
GBP/USD moved lower as traders focused on rising oil prices and reacted to Nationwide Housing Prices report from the UK. The report indicated that Housing Prices declined by -0.2% month-over-month in September, compared to analyst consensus of 0%.
If GBP/USD settles below the 1.3200 level, it will move towards the support level at 1.3150 – 1.3165. A successful test of this level will push GBP/USD towards the next support at 1.3035 – 1.3050. RSI is in the moderate territory, so there is plenty of room to gain momentum in the near term.
EUR/USD Price Forecast
Every new EUR/USD analysis as it publishes, today's technical signal and key levels, live price — on one page.
See all EUR/USD forecastsUSD/CAD Tests Resistance At 1.4235 – 1.4250
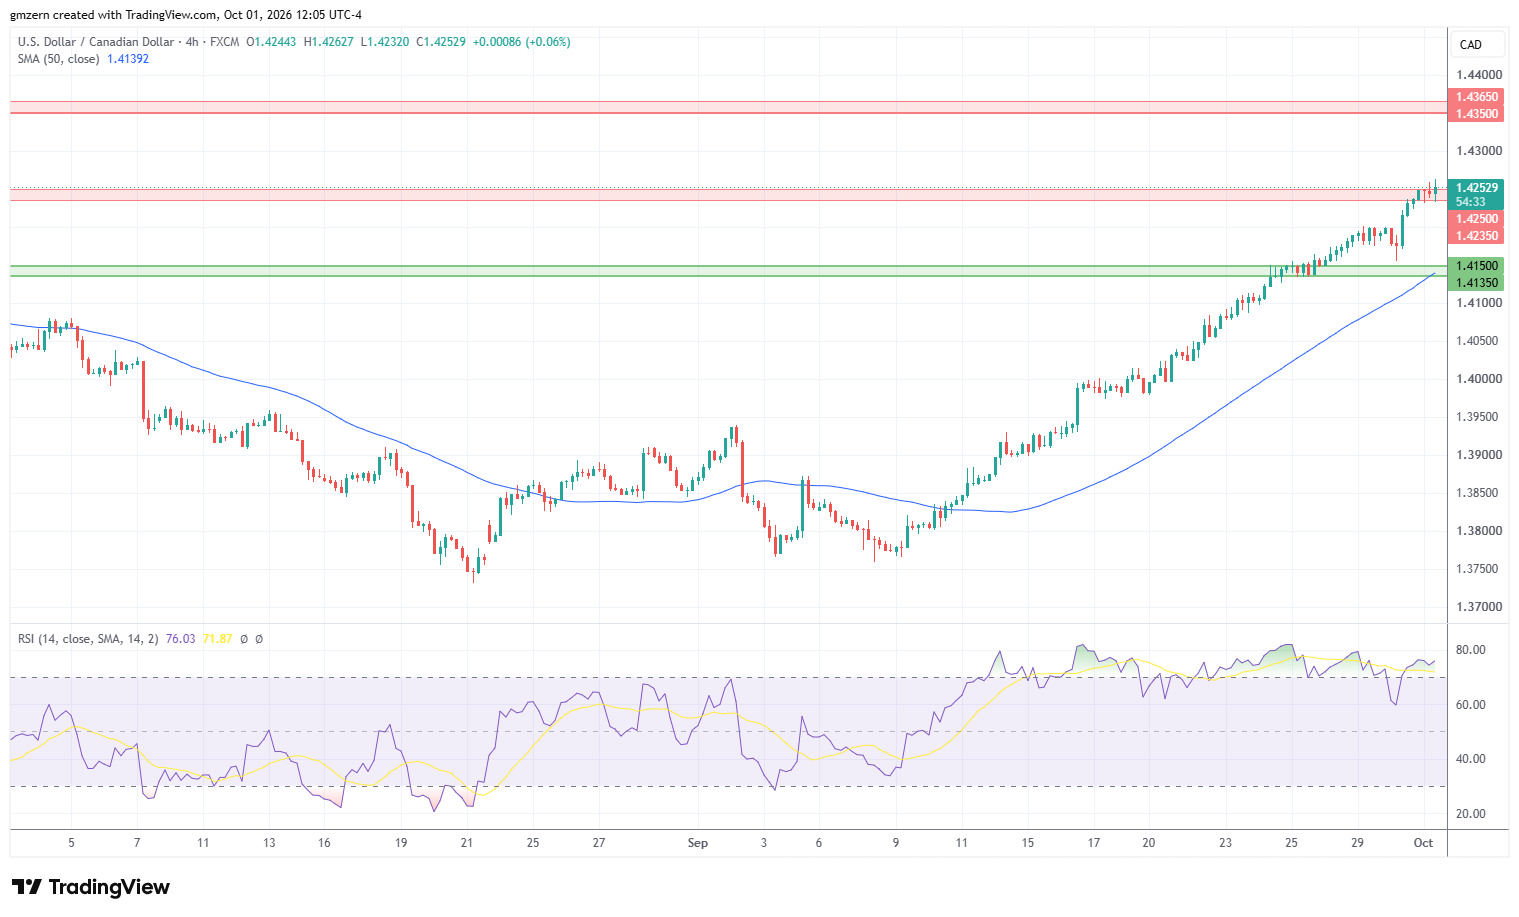
USD/CAD is moving higher as traders react to the weaker-than-expected Manufacturing PMI report from Canada. The report showed that Manufacturing PMI declined from 53.0 in August to 51.5 in September, compared to analyst forecast of 55.
From the technical point of view, USD/CAD continues its attempts to settle above the resistance level at 1.4235 – 1.4250. If USD/CAD manages to settle above the 1.4250 level, it will head towards the next resistance, which is located in the 1.4350 – 1.4365 range.
USD/JPY Moves Higher As Traders Ignore The Pullback In Treasury Yields
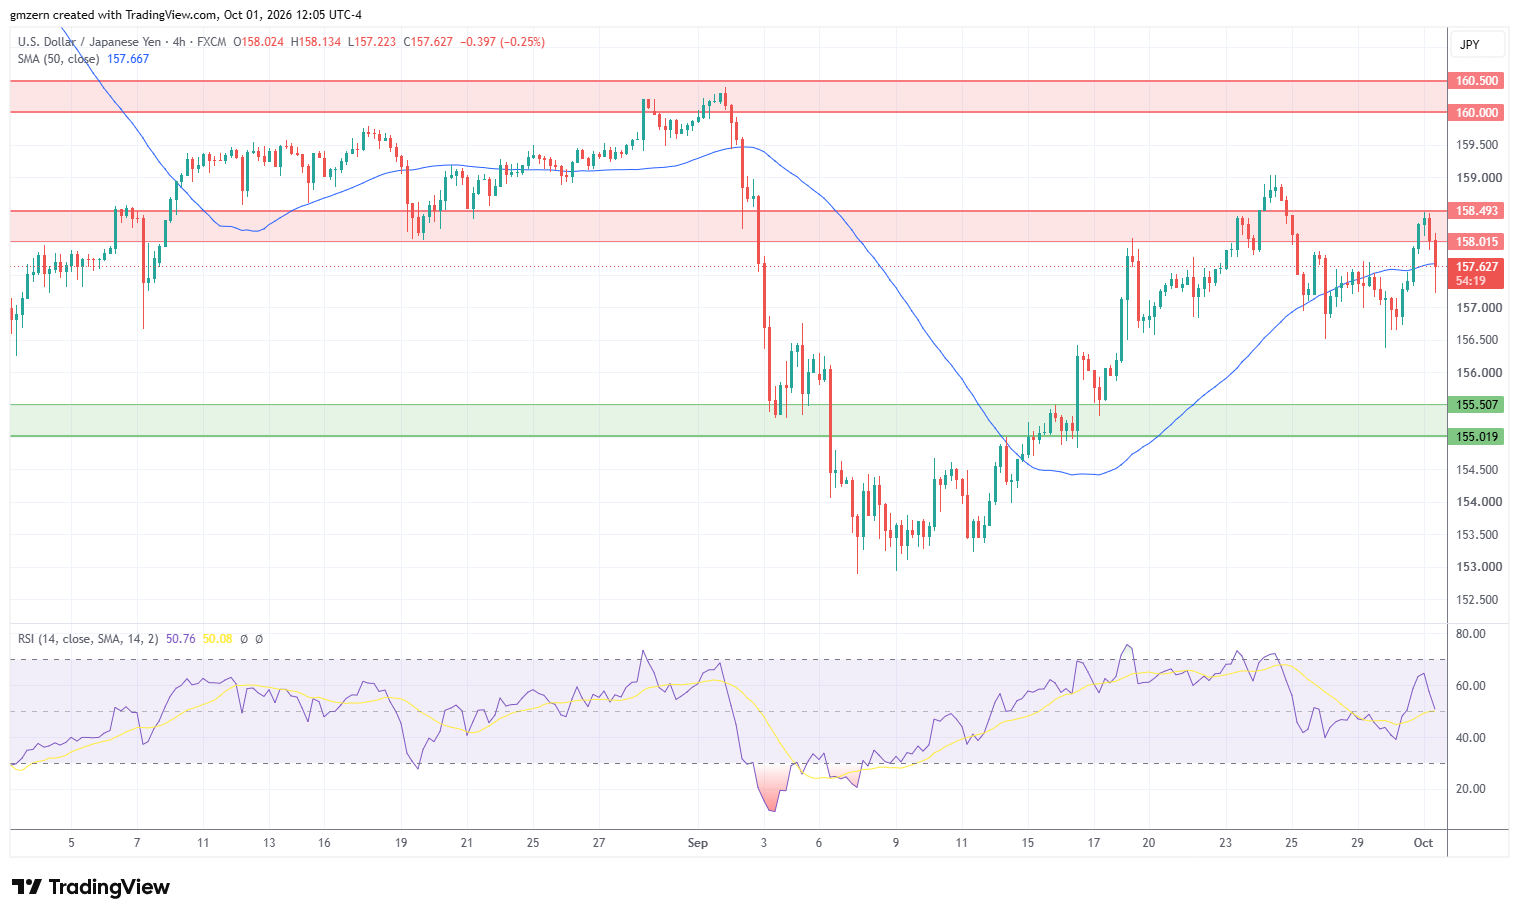
USD/JPY managed to gain some ground despite the pullback in Treasury yields. The yield of 2-year Treasuries declined towards the 4.79% level, while the yield of 10-year Treasuries settled near the 4.23% level.
In Japan, traders focused on Tankan Large Manufacturers Index report. The report showed that Tankan Large Manufacturers Index increased from 22 to 24, compared to analyst forecast of 25.
USD/JPY made an attempt to settle above the resistance level at 158.00 – 158.50 but lost momentum and pulled back. If USD/JPY climbs above the 158.50 level, it will head towards the next resistance at 160.00 – 160.50. On the support side, a move below the 157.00 level will open the way to the test of the support level at 155.00 – 155.50.
If you’d like to know more about how to trade forex, please visit our educational area.