
Gold Bulls Got PCE and Nothing From the Bond Market
Spot Gold (XAUUSD) is a few dollars higher Thursday and still parked under the broken retracement zone. Wednesday’s PCE pop was about all buyers could squeeze out. Bond traders didn’t go along with it. Yields kept working higher, the dollar stayed firm and gold’s been chopping sideways ever since.
It’s not a second hard down day, so give buyers that much. Monday’s sellers still own this market, though.
At 13:42 GMT, Spot Gold is trading at $4,160.35, up $3.22 or +0.08%. It traded from $4,139.27 to $4,193.09.

Traders Pushed the Next Hike Out, Not Off the Calendar
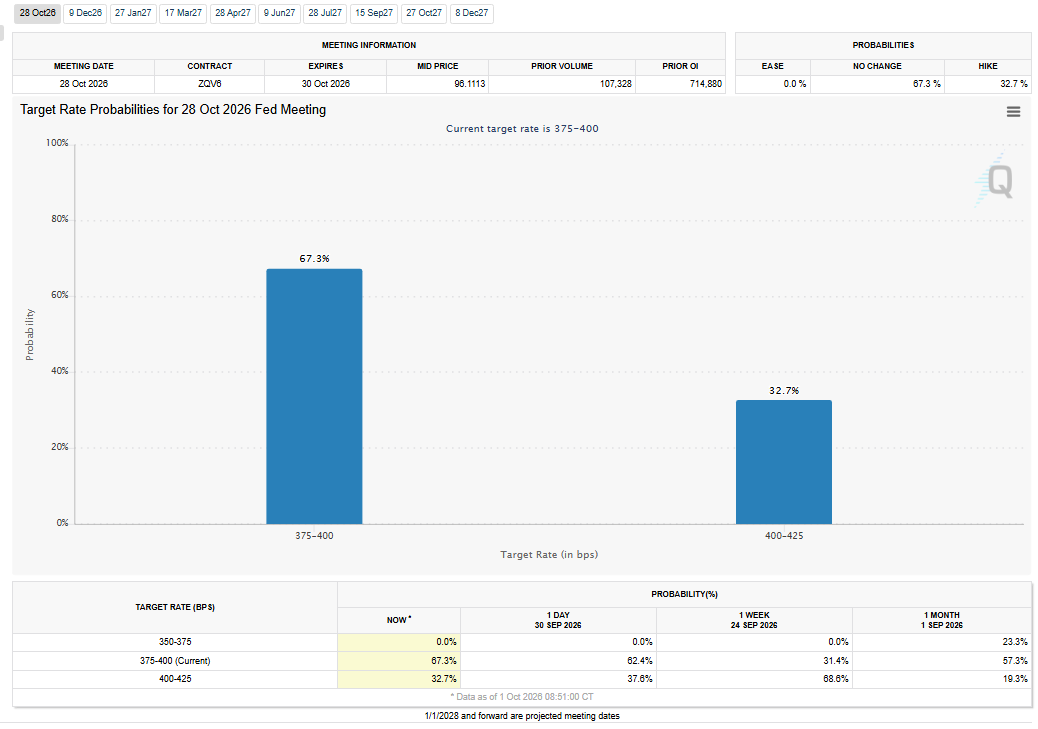
CME FedWatch has the chance of a quarter-point October hike down to 32.7%, from 37.6% a day ago and 68.6% a week ago. The August PCE report did most of that work, and the revisions took some heat off the prior month too. Gold caught a lift on it Wednesday and couldn’t hold it.
Nobody took the next hike out of the calendar. The debate went from whether the Fed is finished to whether it can sit until December. Oil, inflation and all the Treasury debt the market has to soak up are still there after PCE.
Friday’s Non-Farm Payrolls report is the next number with a real shot at moving those odds, and the hawks are looking to it for their answer after PCE.
Gold Price Forecast
Every new Gold analysis as it publishes, today's technical signal and key levels, live price — on one page.
See all Gold forecastsThe Long End Ignored PCE and Gold Felt It

The 10-Year U.S. Treasury yield reached 5.34% Thursday and was holding near 5.32% in the latest trade, still hanging around its highest level since 2002 and far above its 50-day moving average near 4.82%. The 30-Year pushed up near 5.67%, also a 2002 high. Bond sellers didn’t read PCE as an all-clear on inflation.
The short end is trading the October meeting. The long end is trading oil, deficits and Treasury supply, and right now those two trades aren’t talking to each other. Gold is caught on the wrong side of that split. Lower hike odds don’t buy the metal much while long-term yields keep grinding up, which is why the bounce is this small.
The Dollar Is Still Sitting on the Bounce
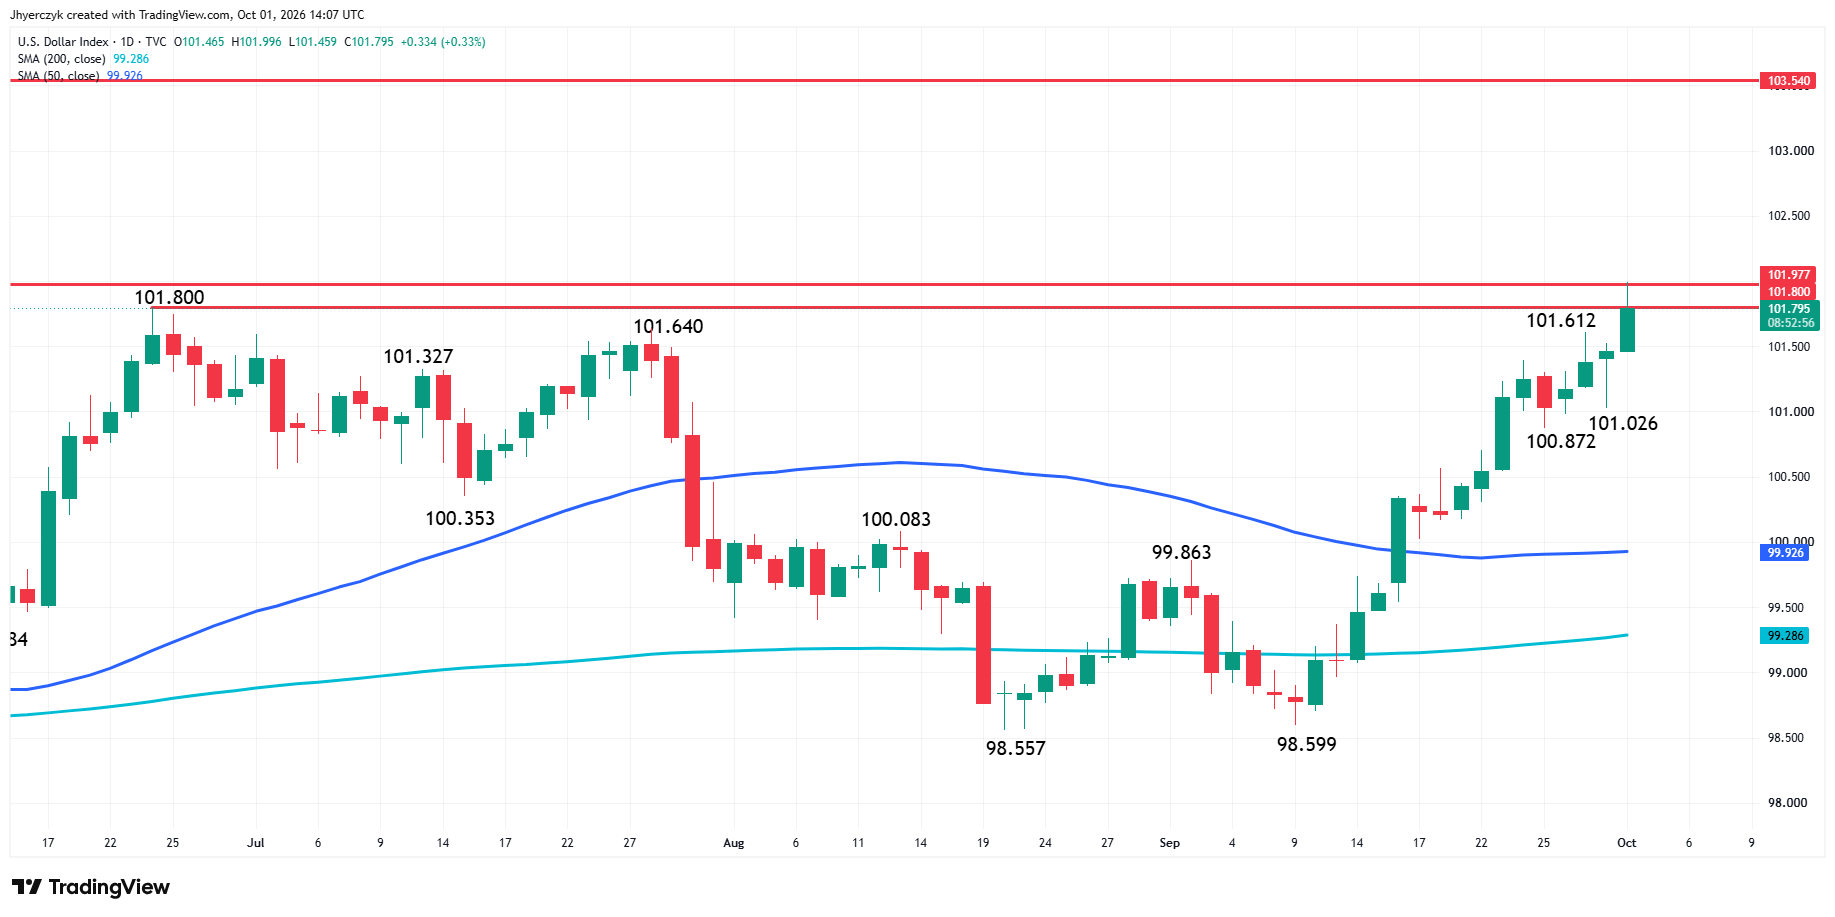
The U.S. Dollar Index reached 101.996 Thursday and is holding near 101.80, well above its 50-day moving average at 99.93. Currency traders are following the long end of the curve, not the October meeting. With yields still climbing, the dollar has no reason to give back much ground, even with the next Fed move pushed out.
Gold buyers are trying to repair broken support with the dollar still bid against them. That’s a tough trade to make work in one session.
HSBC Cut Its Forecast but Sees Central Banks Buying Dips
HSBC cut its average gold-price forecasts for 2026 and 2027 and said in the same note that the metal may be nearing a bottom. The bank expects central banks to step back in on declines, especially near or below $4,000.
I’ll take that as a longer-term floor argument. It doesn’t help Thursday’s trade with gold stuck under broken resistance.
Daily Spot Gold (XAUUSD) Technical Analysis
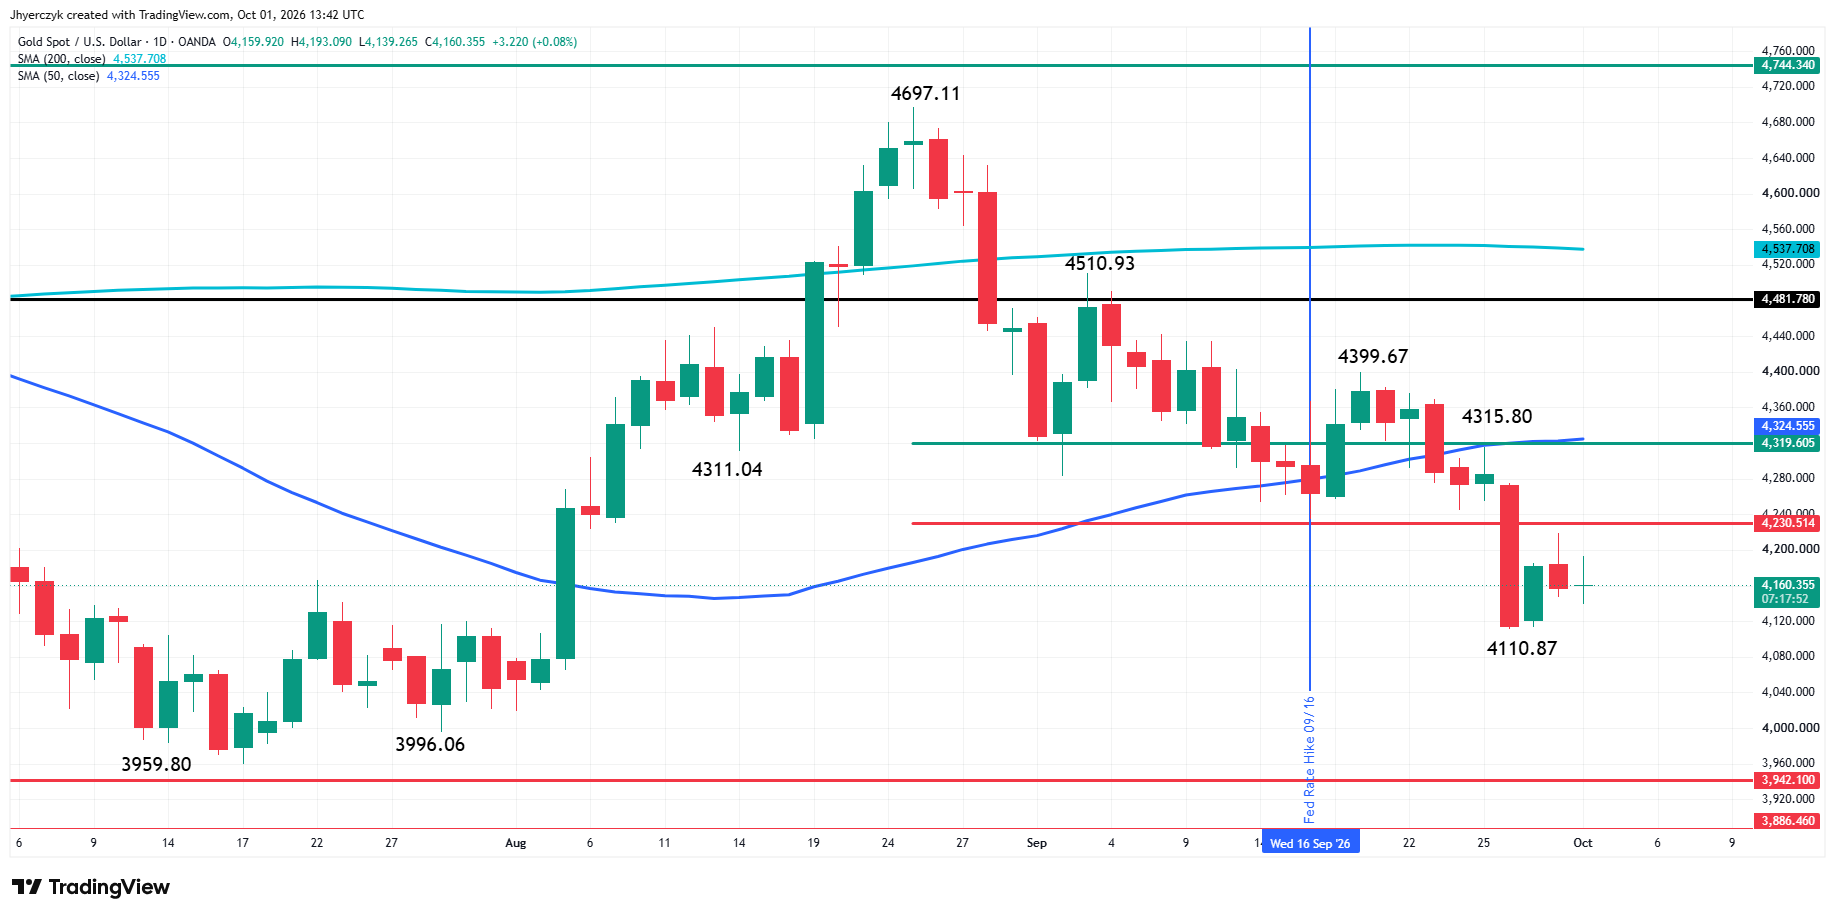
Spot Gold is slightly higher Thursday after posting a third straight sideways session inside Monday’s wide range.
The main trend is down according to the daily swing chart. A trade through this week’s low at $4,110.87 will signal a resumption of the downtrend and could open the door to a test of the main bottoms at $3,996.06, $3,959.80 and $3,942.10. A trade through the lower top at $4,399.67 will change the main trend to up.
The long-term range is $3,942.10 to $4,697.11. Spot Gold is trading on the weak side of its $4,230.51 to $4,319.61 retracement zone, making that area resistance. The 50-day moving average at $4,324.60 sits just above the upper boundary, creating a resistance cluster.
A counter-trend rally could bring buyers back into the $4,230.51 to $4,324.60 area, however, they need to take offers through the cluster before the recovery can build momentum. Failure to do so would leave this week’s low at $4,110.87 exposed.
What to Watch
Friday’s Non-Farm Payrolls report is the next shot at the dollar and yields. Gold made it through PCE without breaking down, and it didn’t get a turnaround out of the number either. The 10-Year and the Dollar Index are the tell going into the jobs report, and both spent Thursday pressing their highs while gold went nowhere.
The bias leans bearish with the main trend down on the swing chart and Spot Gold trading under both the retracement zone and the 50-day moving average. Thursday’s bounce stalled before it reached $4,230.51, and the cluster up through $4,324.60 belongs to sellers. Buyers have held $4,110.87 all week, with the main bottoms sitting right in the area where HSBC expects central banks to start buying.
If you’d like to know more about how to trade gold, please visit our educational area.