Tech Has the Bid but Bonds Are Still Selling
Technology has the early bid to start October. Micron, Alphabet and Accenture all handed tech buyers something to work with overnight and into Thursday morning, and Nasdaq-100 futures are out front with nothing else close.
The bond market is still the problem. Long-term Treasury yields are pushing to levels traders haven’t seen in more than two decades and the broad indexes are carrying that weight into the opening. The S&P 500 futures chart hasn’t picked a direction yet.
In premarket trade, S&P 500 futures are up about 0.3%, Nasdaq-100 futures are higher by about 0.6% and Dow futures have added roughly 0.2%.

Daily December E-mini S&P 500 Index Futures Technical Analysis
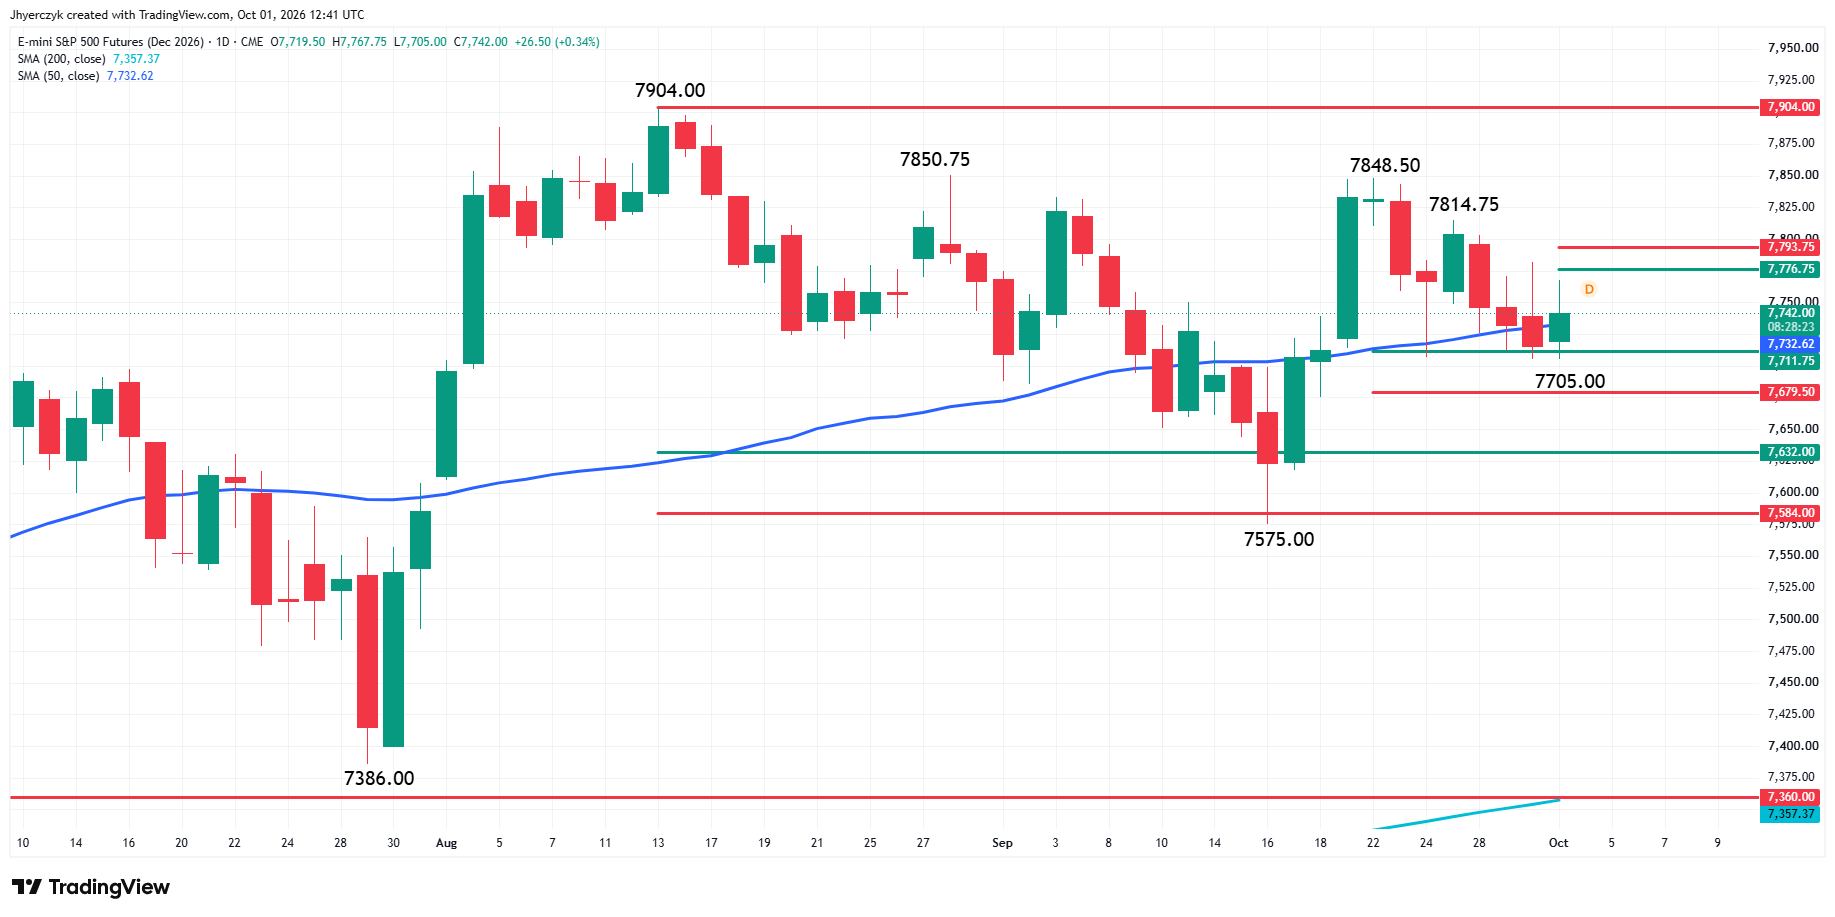
December E-mini S&P 500 Index futures are trading slightly higher shortly before the cash market opening Thursday. The contract is straddling the 50-day moving average at 7,736.50.
The main trend is up according to the daily swing chart. A trade through 7,848.50 will reaffirm the uptrend, with the record high at 7,904.00 the next target. A trade through 7,575.00 will change the main trend to down.
The minor trend is down. A trade through 7,814.75 will change the minor trend to up.
The key support zone is 7,711.75 to 7,679.50. The market tested the support zone overnight, reaching 7,705.00 before buyers came in. If the zone fails as support, the next target area is 7,632.00 to 7,584.00.
The first resistance zone is 7,776.75 to 7,793.75. Buyers are going to have to overcome 7,793.75 in order to extend the rally.
Daily December E-mini Nasdaq-100 Index Futures Technical Analysis
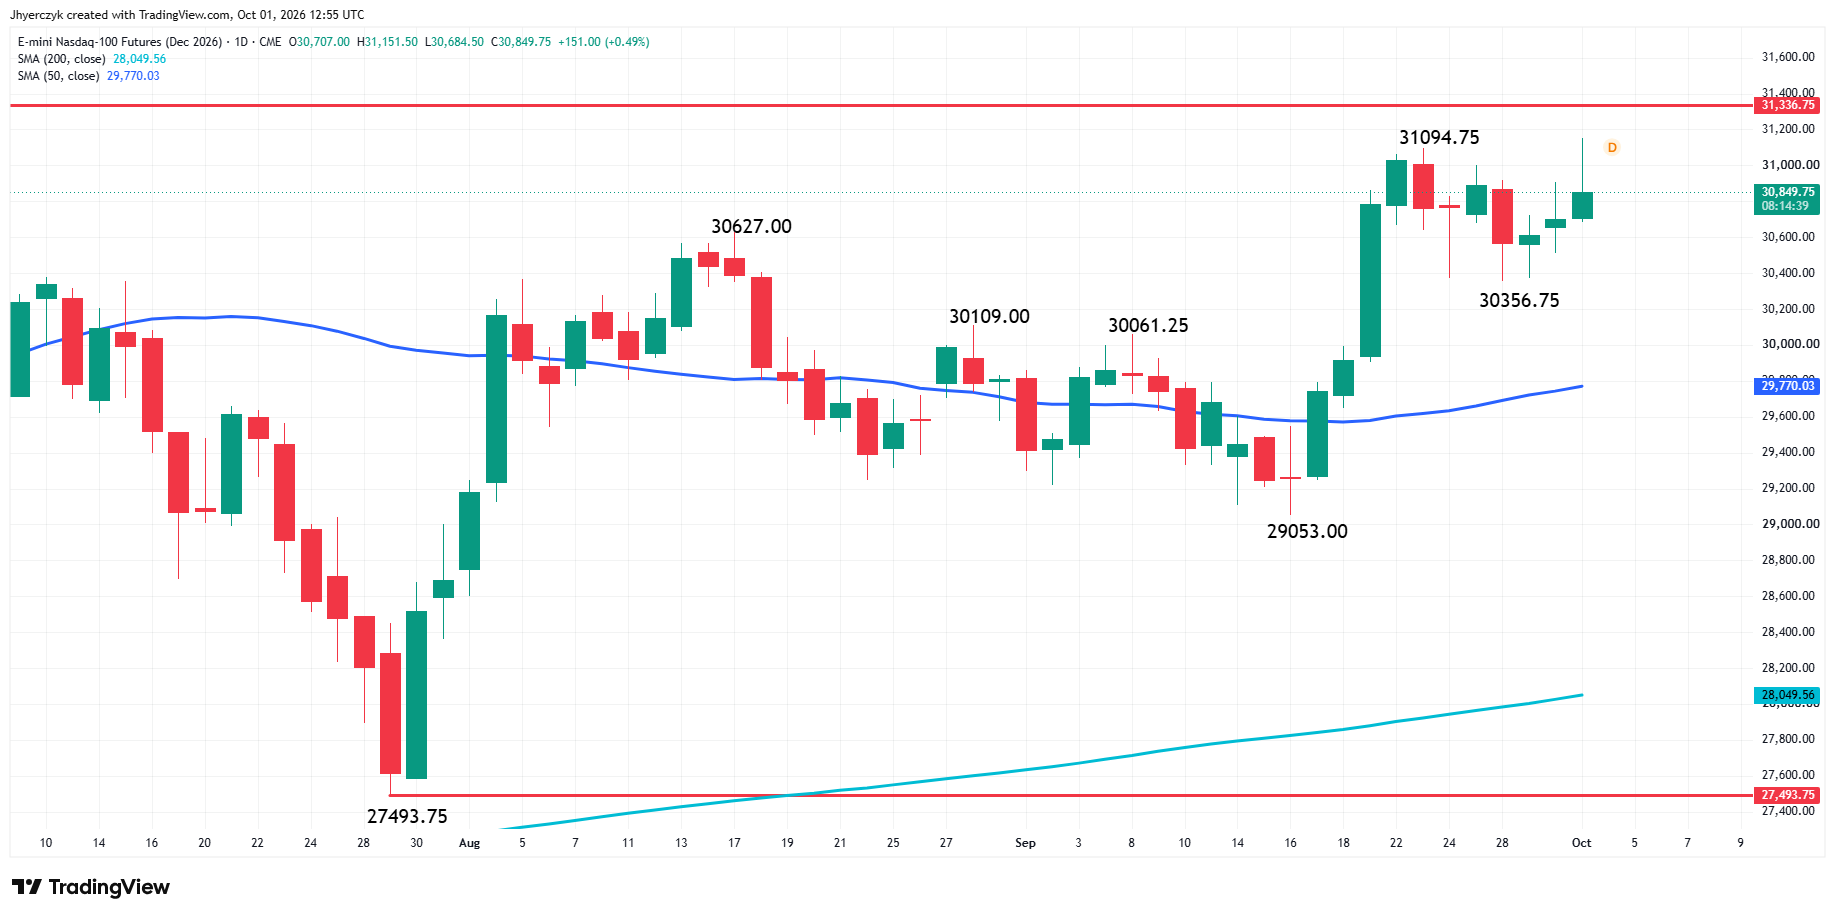
December E-mini Nasdaq-100 Index futures are trading higher shortly before the cash market opening. The earlier rally to 31,151.50 confirmed 30,356.75 as a new main bottom. A trade through this bottom will change the main trend to down.
The next major upside target is the record high at 31,336.75. If the trend changes to down, then the 50-day moving average at 29,770.11 will come into play.
Micron’s Beat Has the Whole Chip Group Bid Early
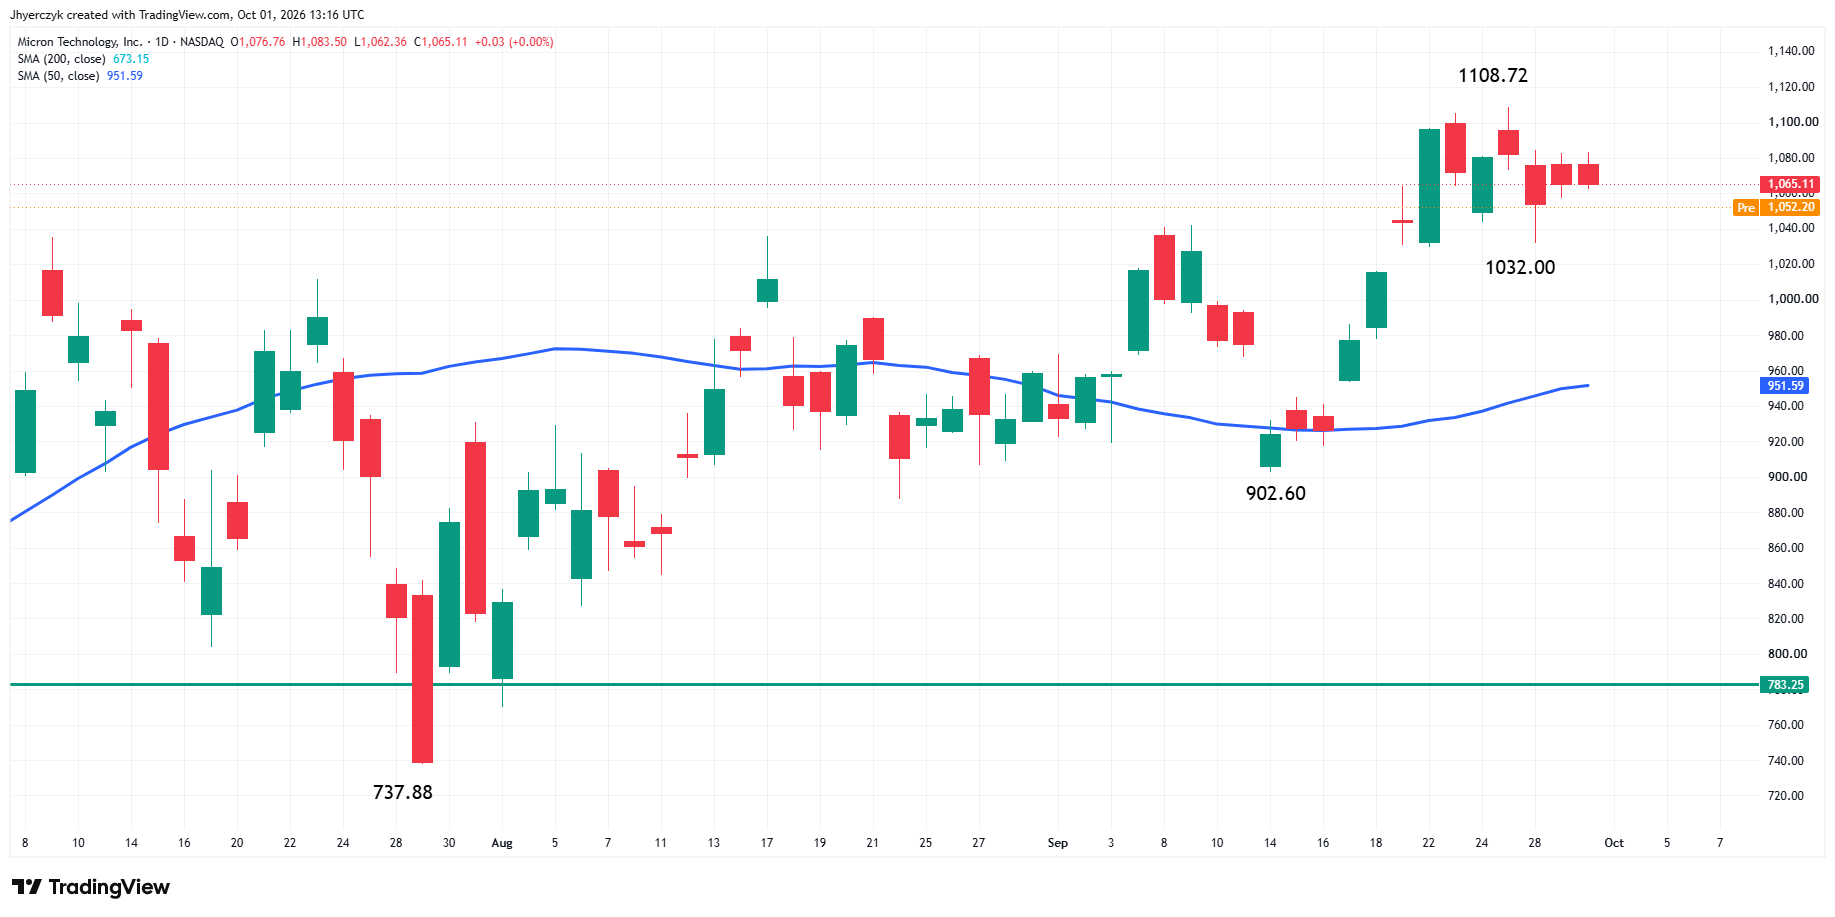
Micron delivered. The company crushed earnings, revenue nearly quadrupled from a year ago and the outlook came in ahead of the Street. After a mixed Wednesday session, chip buyers got their reason to come back and they didn’t wait for the opening bell.
Nvidia, AMD and Broadcom are all higher premarket. I’m not reading much into the Bloomberg report that Micron plans to raise worker pay. It could pinch margins, and margins are what the Street is watching on this name, but it’s a Micron problem. It doesn’t touch the memory demand coming out of the AI data-center buildout.
What Micron hasn’t answered is whether anybody wants to pay up for chips with long-term yields where they are. Strong earnings on one side, a rising discount rate on the other. Technology has to work through both today.
Accenture Shows the AI Spending Is Turning Into Revenue
Alphabet shares are up almost 2% before the bell on the release of Gemini 4 Argon, its newest model aimed at advanced coding, cybersecurity and professional work.
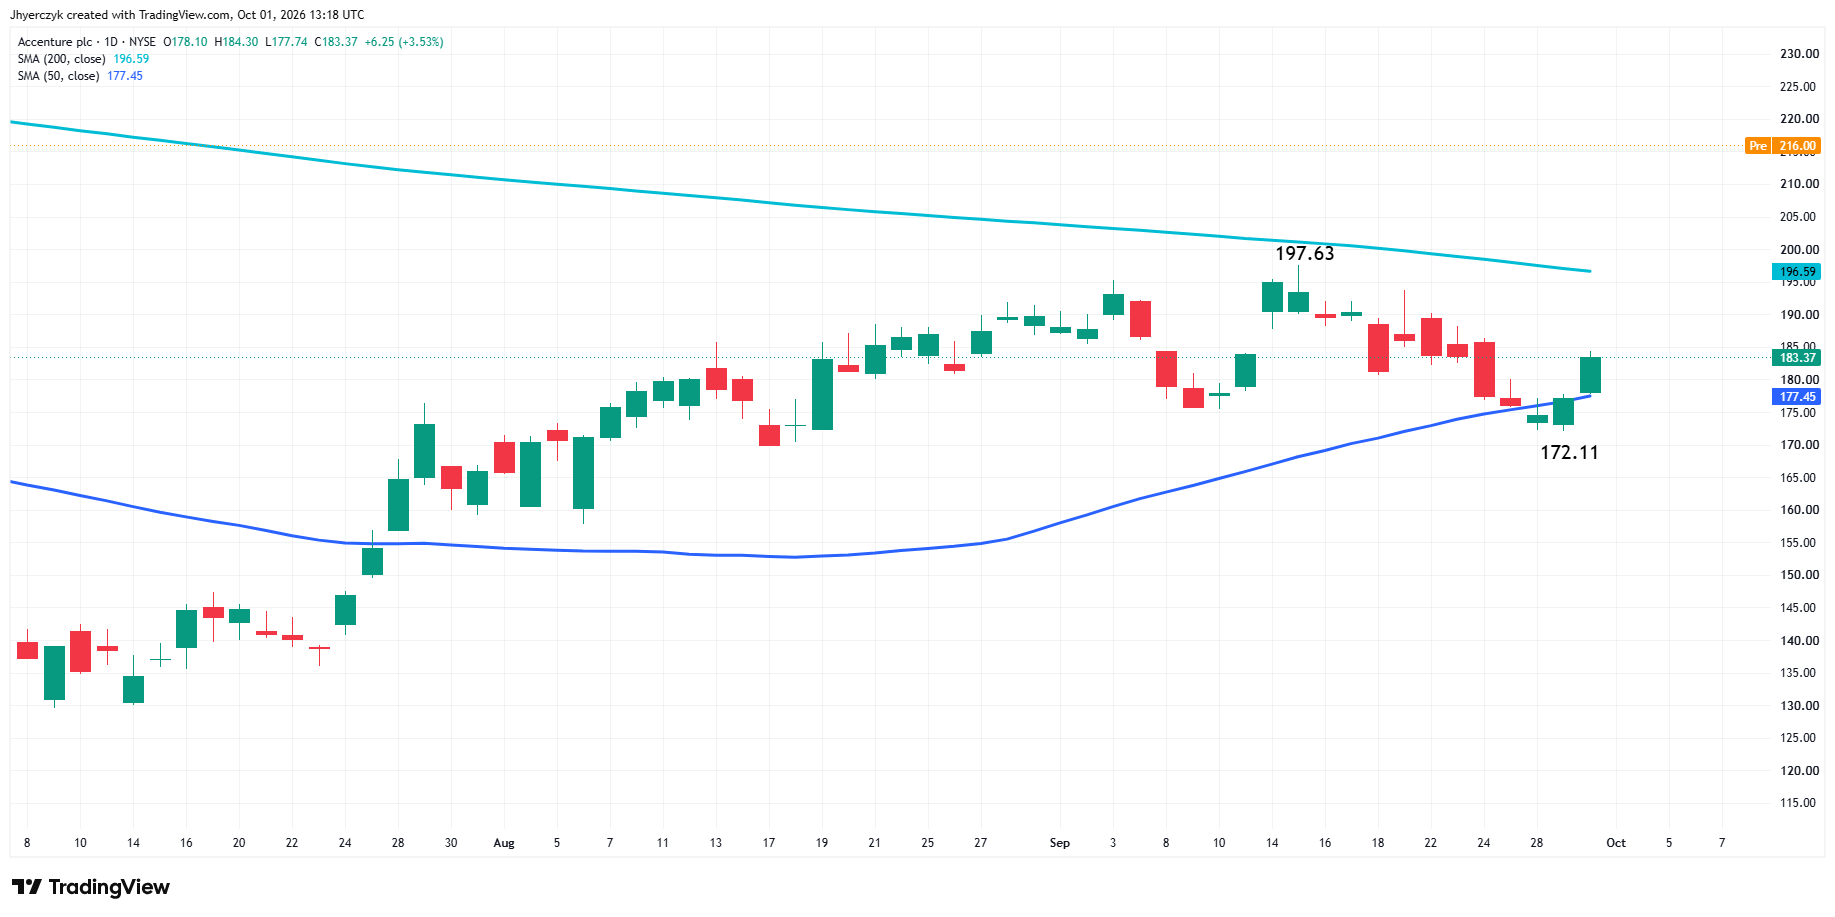
Accenture is the more interesting move. The shares jumped after fiscal fourth-quarter earnings beat estimates and the company raised its dividend. Enterprise clients are spending and Accenture is booking it as revenue. Investors are still paying up for that.
September ran on the same split. The Nasdaq Composite Index gained 1.9% last month while the S&P 500 Index slipped 0.5% and the Dow Jones Industrial Average lost 4.3%. Money stayed parked in AI infrastructure, software and data centers and everything else got stuck holding the rate problem. Flipping the calendar to October didn’t move that money anywhere.
Bond Sellers Shrugged Off the Soft PCE Report
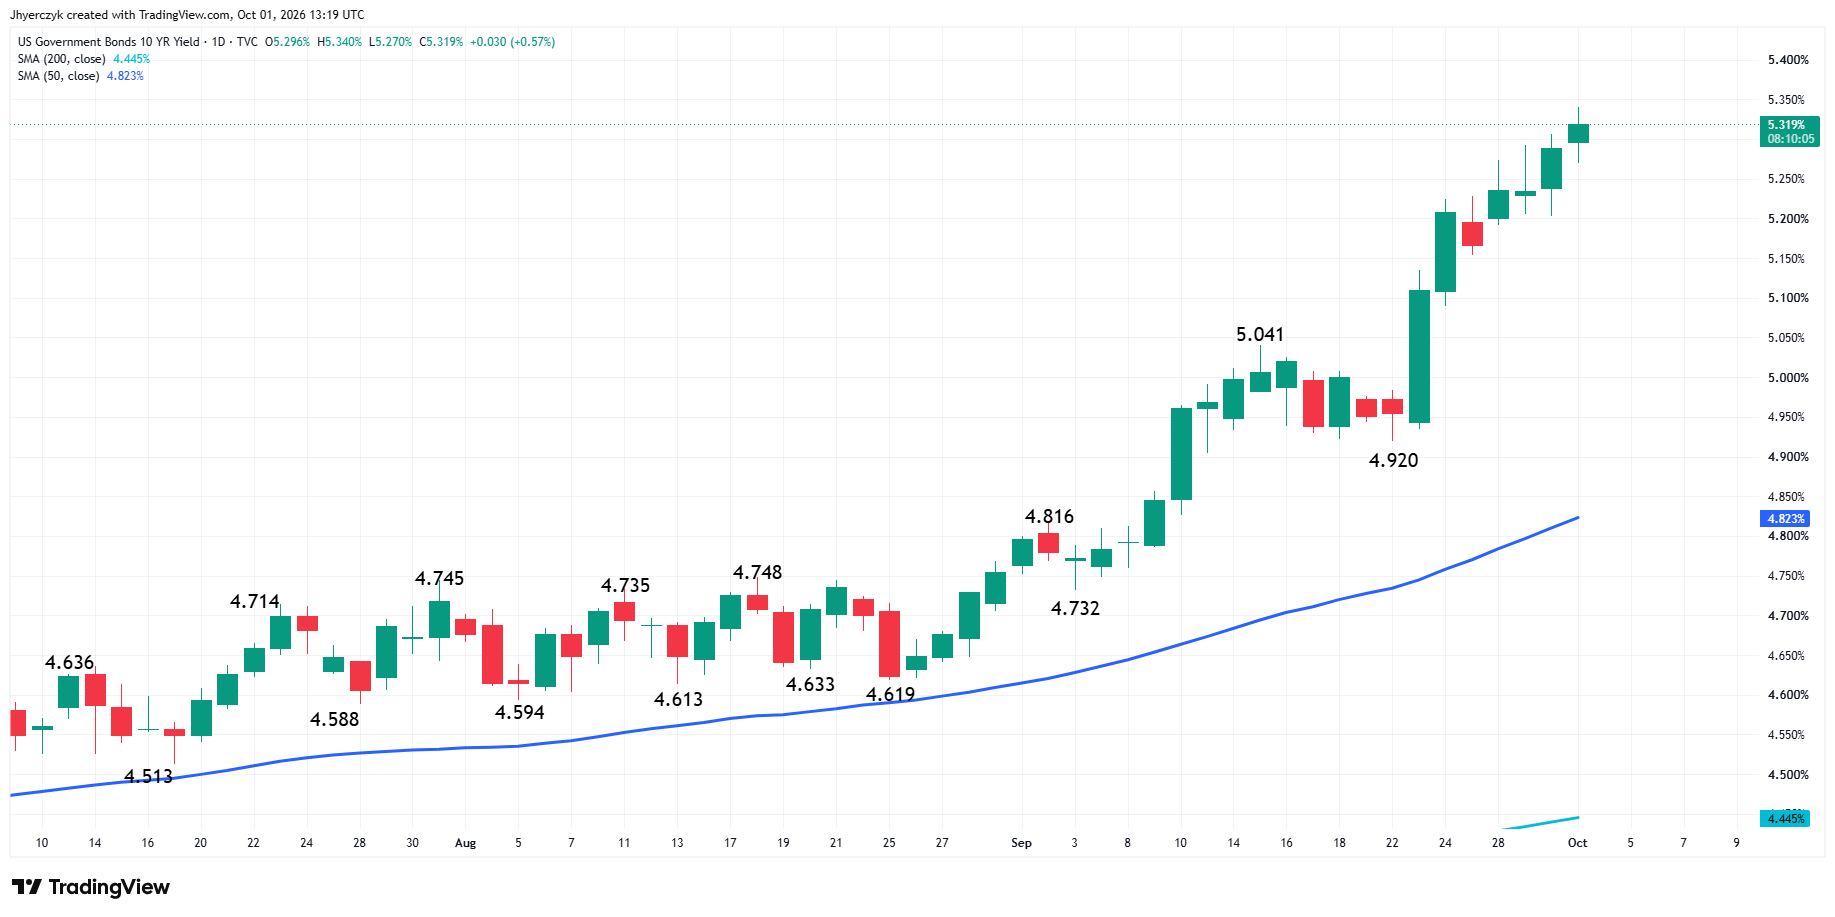
The 10-Year U.S. Treasury yield broke above 5.33% Thursday and the 30-Year pushed toward 5.67%, both at levels last seen in 2002. The soft August PCE report knocked down the odds of an October rate hike and the long end ignored it. Bond traders aren’t trading one Fed meeting here. They’re trading supply, deficits, inflation and what it takes to get somebody to own long-dated paper.
Minneapolis Fed President Neel Kashkari gave them one more reason to sit tight, saying investment in data centers, power, water and related infrastructure may be lifting the neutral rate of interest. So the AI build feeding the chip rally may be feeding the rate problem too, and it’s landing while the government is issuing a lot of debt.
WTI crude is back above $91 a barrel early Thursday with traders watching for the next turn in the Iran conflict. Treasury sellers don’t need anyone to spell out what $91 oil does to inflation.
Financials, real estate, industrials and the smaller companies have no AI story to lean on, and they’re the ones the bond market is squeezing.
What to Watch
Initial jobless claims hit first this morning and they lead straight into Friday’s Non-Farm Payrolls report. Nike reports after the close. None of it outranks the 10-Year. Chip earnings are pulling technology higher while the long end keeps climbing, and the S&P 500 Index and the Dow Jones Industrial Average are stuck watching from the sidelines. Friday’s payrolls number has to give the bond market a reason to stop selling.
December E-mini S&P 500 Index futures held the support zone on the overnight test and are sitting on the 50-day moving average at 7,736.50 shortly before the cash opening. The 50-day moving average is running this session, and the rally doesn’t get going until 7,793.75 goes.
Nasdaq-100 futures have the cleaner chart. The earlier rally locked in 30,356.75 as the main bottom, and the contract is higher again before the opening with the record high at 31,336.75 the next stop.
More Information in our Economic Calendar.