



Dollar Index Outlook: Treasury Yield Surge Lifts Dollar as EUR and GBP Face Inflation Risks
The U.S. dollar starts October with positive news from rising U.S. Treasury yields. While falling September inflation reduces the possibility for a September Fed fund rate increase, rising yields make October rate hike chances more positive.
The U.S. CPI report for September was released on September 14 and showed a larger than expected decline in month over month inflation. The report also revised the previously reported July CPI to show a smaller than initially reported increase in inflation. As a result, the expected probability of a September Fed Fund rate increase fell from 50% to 38% where it has remained. Philadelphia Fed President John Williams also said he does not see an immediate need for an interest rate increase. However, in recent weeks, other long-term U.S. Treasury yields have increased to levels last seen in 2007.
An increasing divergence between short-term and long-term interest rates has become more positive for the U.S. Dollar. Falling longer-term U.S. Treasury yields would help to alleviate the current high inflation and bond market pressures. However, U.S. treasuries have come under pressure due to increased government spending and borrowing. The U.S. Dollar Index reached its highest level in more than three months, on September 15.
Difficult conditions persist for the euro. Recent developments have witnessed a build up in inflation throughout the eurozone. As usual, the ECB is taking a dovish stance despite rising inflation, citing that wage inflation has not materially increased. The euro fell by the most since July 2022 in September.
British economic data showed that the UK economy grew by more than expected in the last quarter. However, tighter financial conditions are expected to dampen economic activity going forward. Markets expect interest rate hikes by the BOE in November and February.
The U.S. dollar is expected to appreciate against the euro and British pound. The Employment Situation Report, which is expected to show strong non-farm payroll growth, could increase market uncertainty ahead of the weekend.

U.S. Dollar Index Technical Analysis: DXY Holds 101.45 Breakout as 101.78 Becomes the Next Upside Test
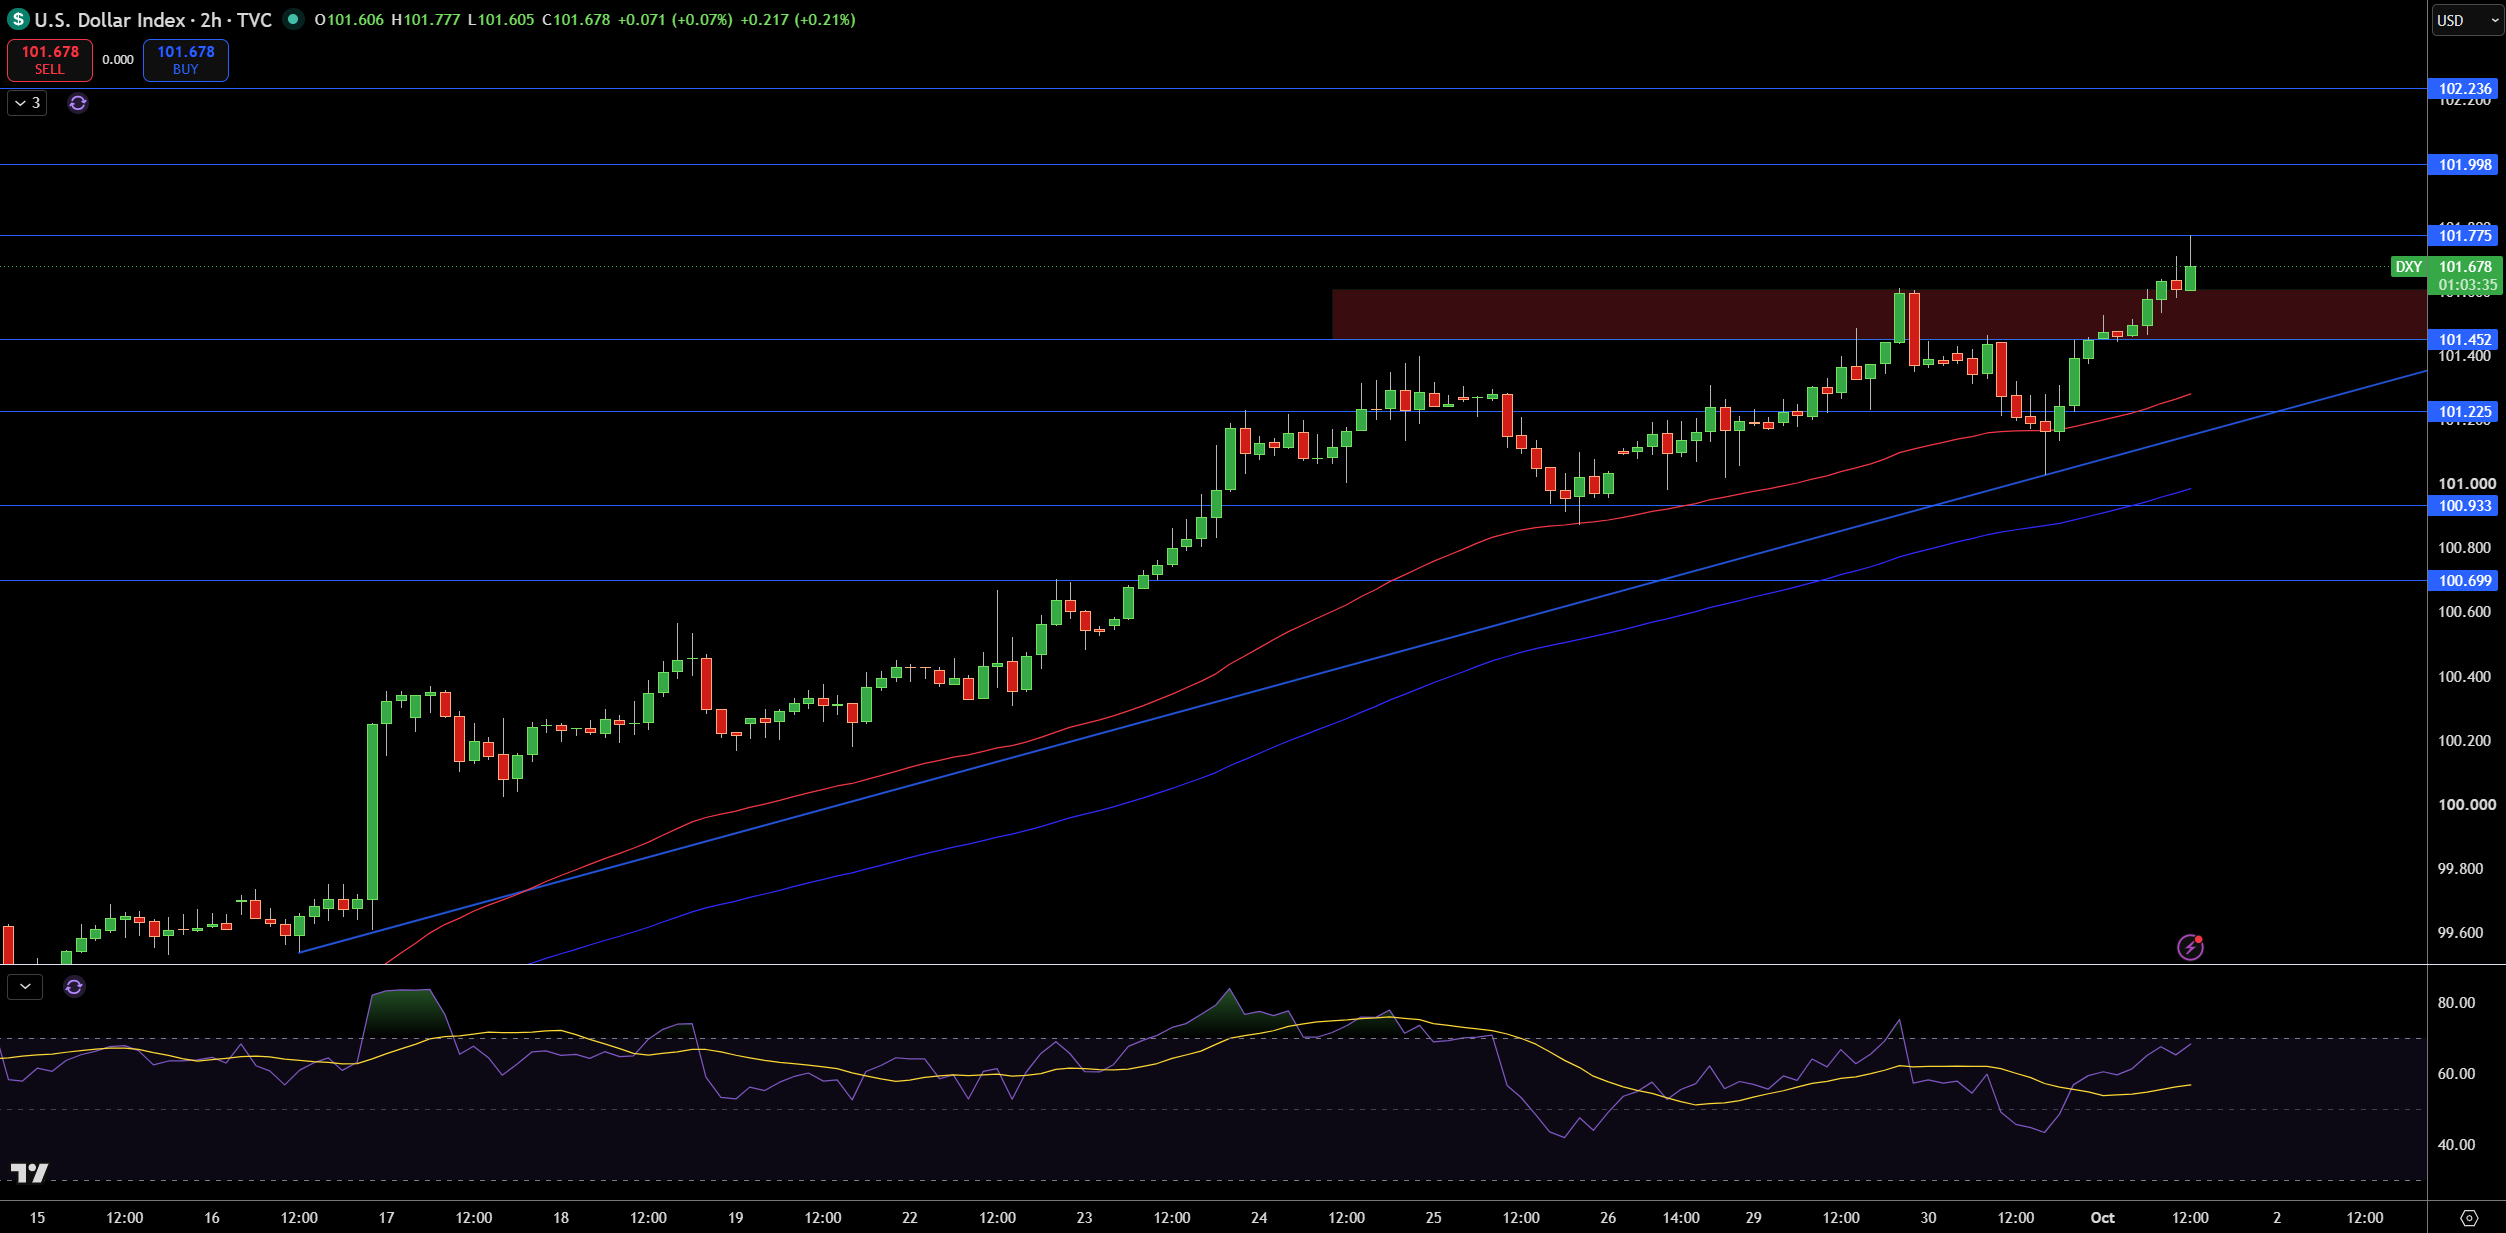
The DXY is trading at 101.68 and recently broke out above the 101.45 level. Looking at the 2 hour time frame, DXY remains in an overall bullish trend with a rising base line. Furthermore, the moving averages are in a good condition with the 50 SMA below the 200 SMA, which indicates a bullish short term trend.
101.78 is the next level of resistance. If broken, the next level of resistance would be 102.00, with 102.24 providing potential resistance thereafter.
Looking at RSI on the 2 hour time frame, it supports the overall bullish trend and momentum with values currently above 50. If the bullish trend remains, support would come in at 101.23 and 100.93. A break below 101.45 would negate the bullish case for DXY. If the trend line continues higher, subsequent resistance would come in at 101.78, with a break above that level possibly targeting 102.00.
EUR/USD Price Forecast
Every new EUR/USD analysis as it publishes, today's technical signal and key levels, live price — on one page.
See all EUR/USD forecastsGBP/USD Technical Analysis: Sterling Slips Below 1.3250 as 1.3205 Support Comes Back Into Focus
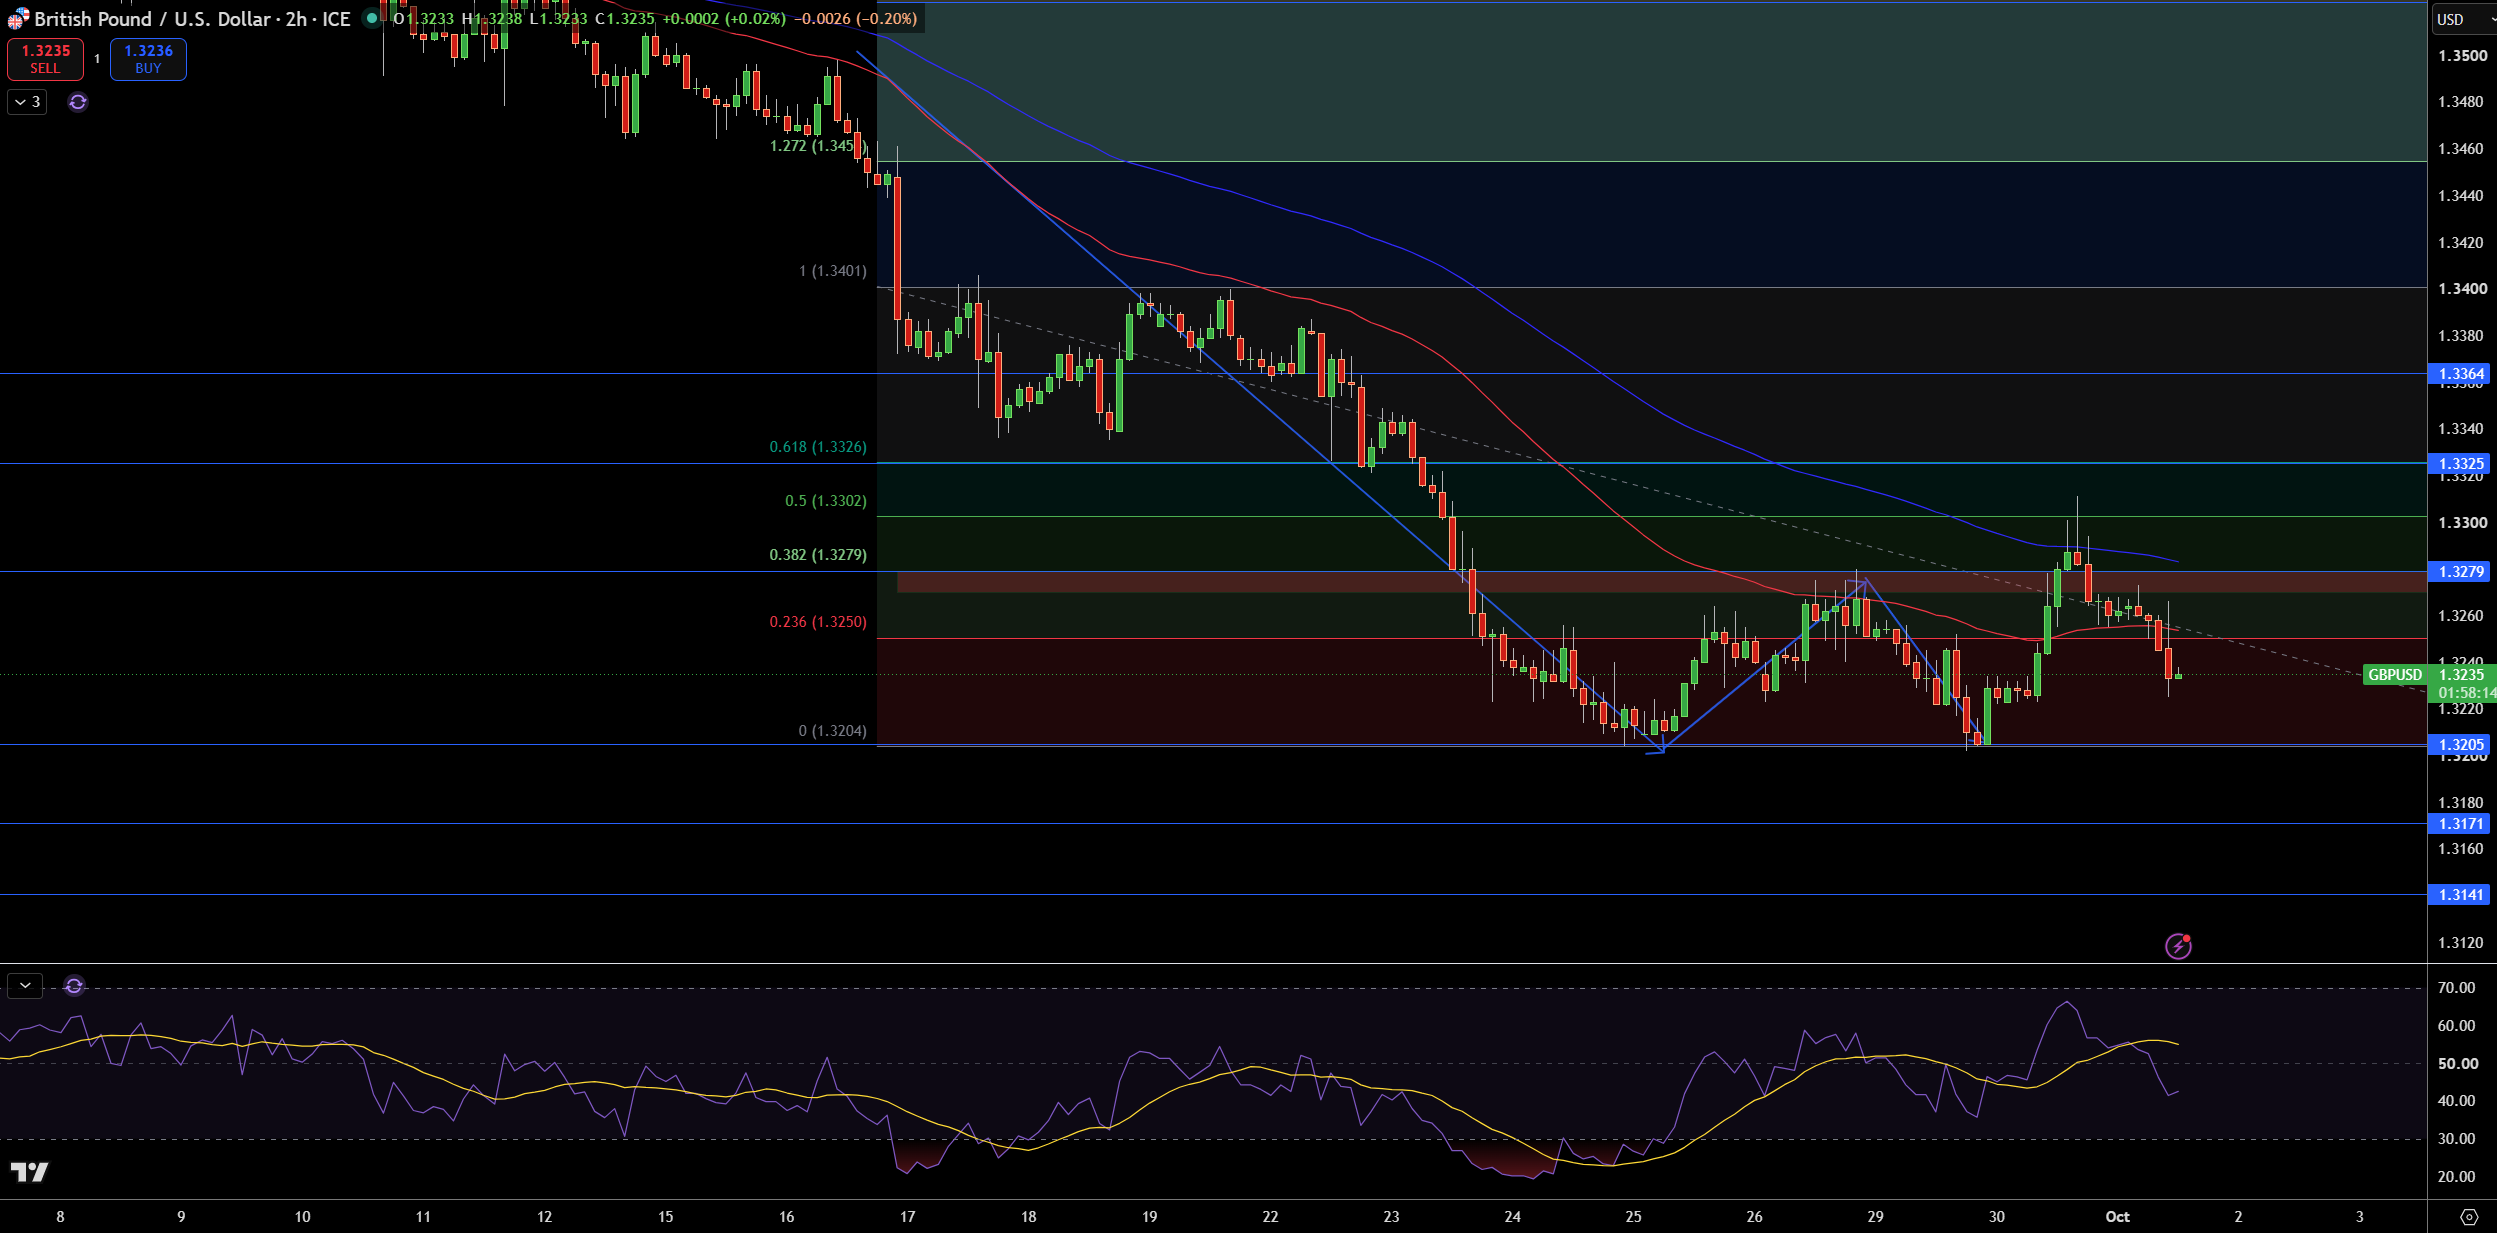
The British Pound is trading at 1.3235 against the US Dollar, and is facing further losses after failing to rise above the 1.3250 level. The British Pound is trading below the 100 and 200 hour moving averages, as well as the recent down-trend.
Current support is at the 1.3205 level, which has previously provided support on several occasions. If the British Pound breaks below 1.3205, further losses can be expected to the 1.3171 and 1.3141 levels. If the British Pound is able to rise above the 1.3250 level, it can test the 1.3279 and 1.3302 levels, with further resistance expected at the 1.3325 level.
The Relative Strength Index (RSI) is indicating a loss of momentum by the British Pound, which suggests a further decline can be expected. I will be looking to take bearish positions on the British Pound below the 1.3250 and 1.3279 levels. I will take bullish positions if the 1.3302 level is broken. A further decline can be expected to the 1.3205 level. A break below the 1.3171 and 1.3141 levels can be expected to be limited.
EUR/USD Technical Analysis: Euro Breaks 1.1312 Support as 1.1283 Becomes the Next Downside Test
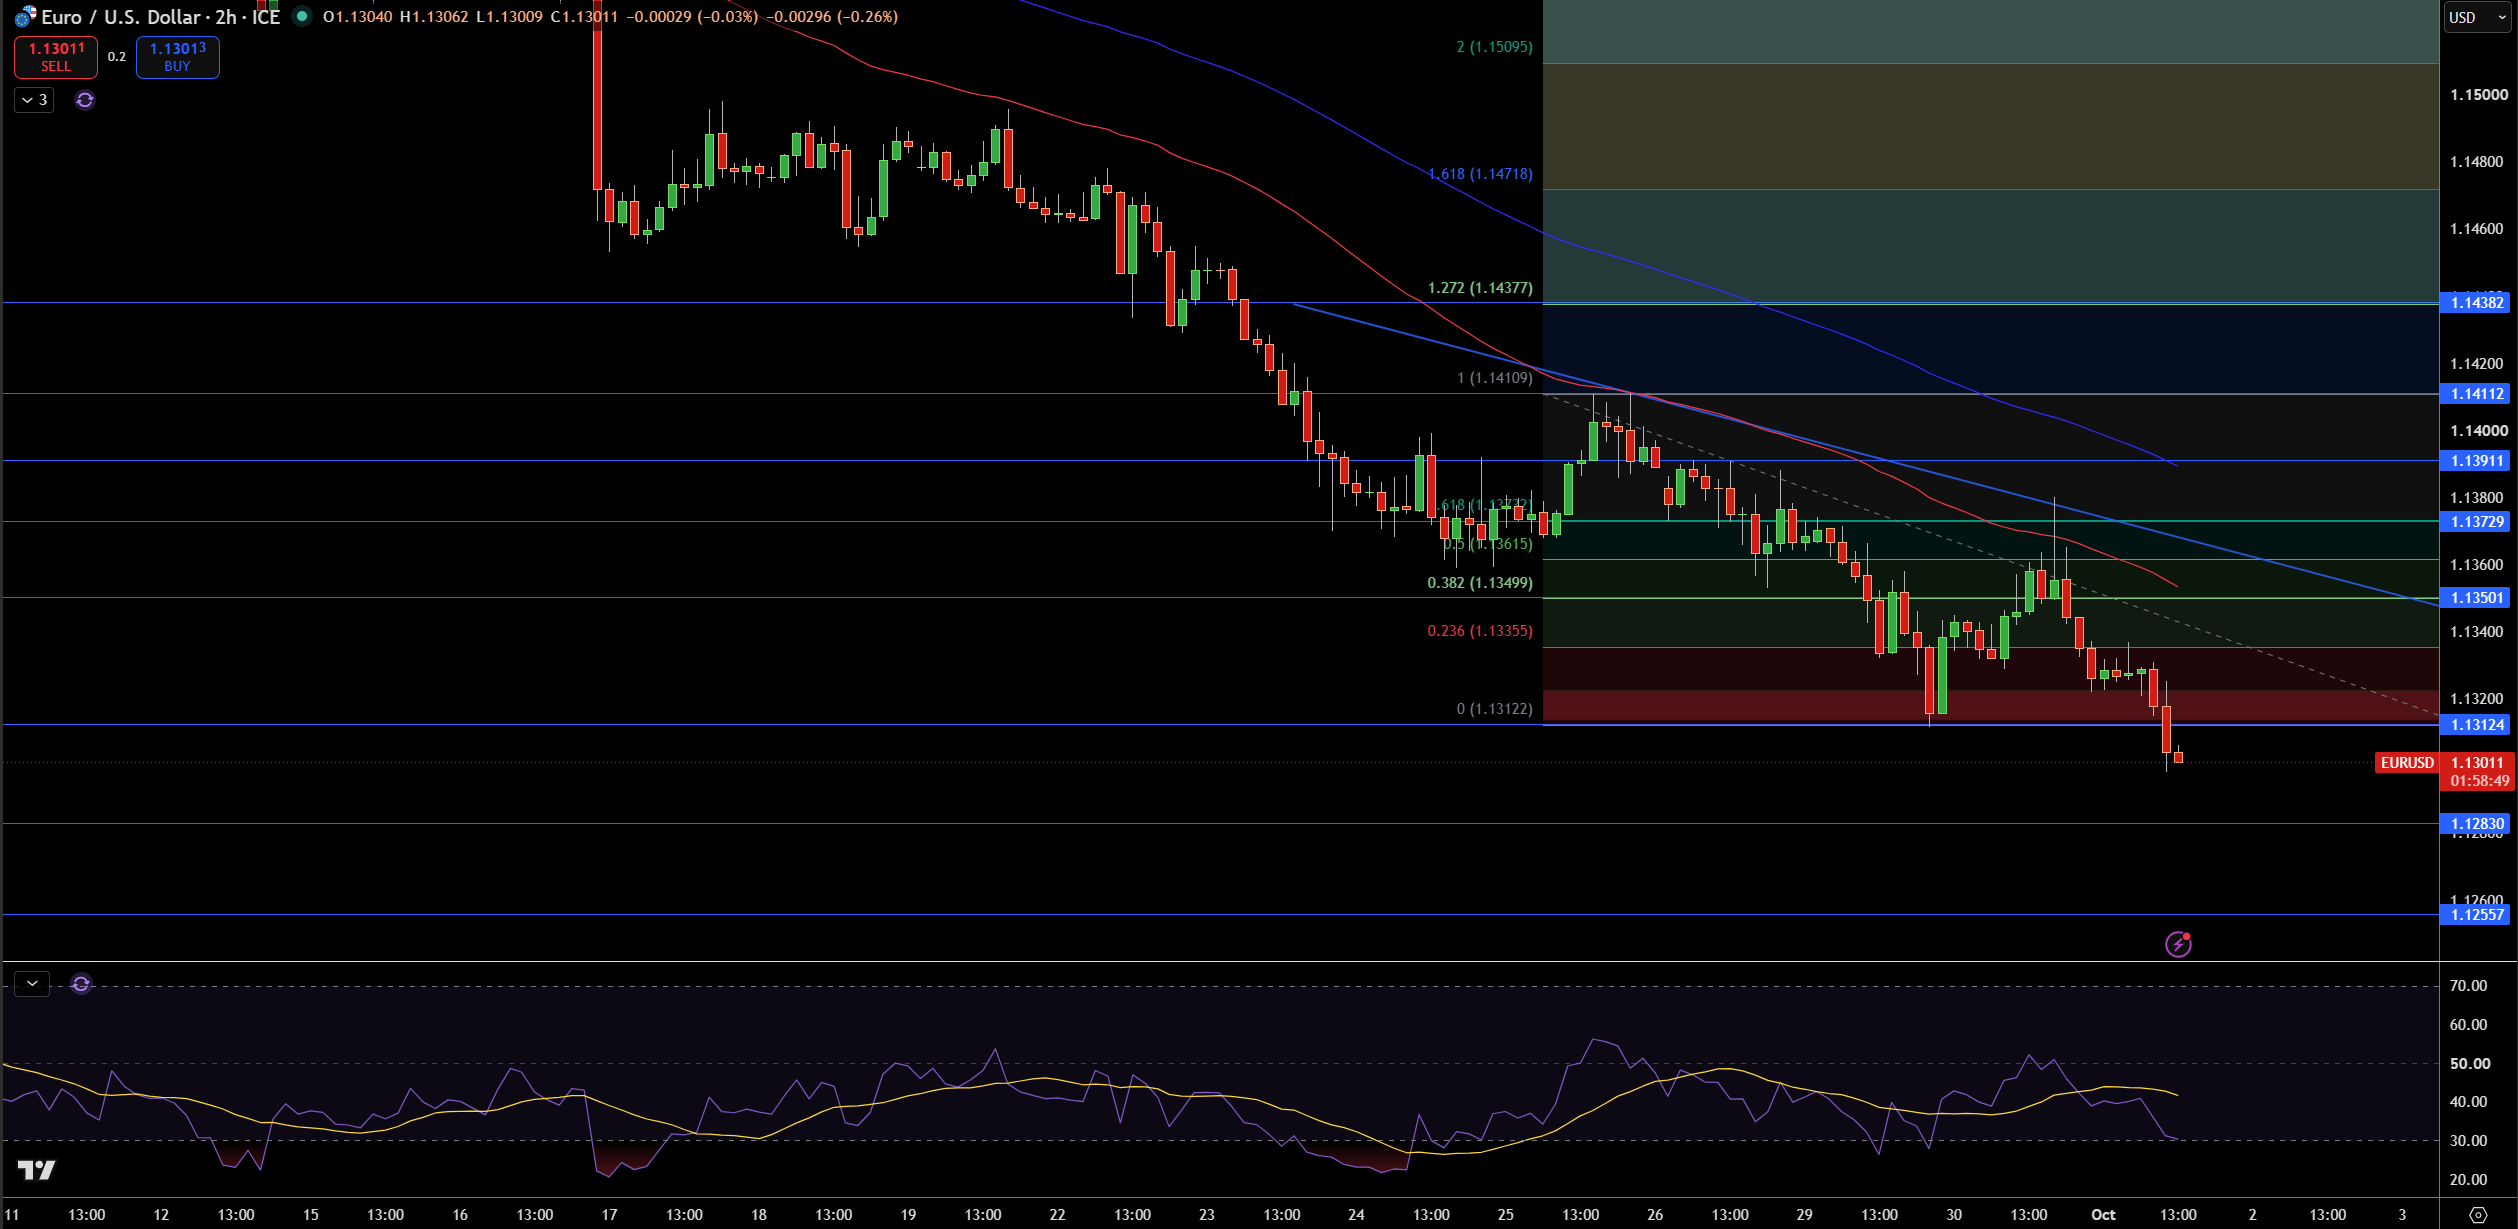
The EUR/USD is currently at 1.1301 on the 2 hour chart. I see that the pair broke 1.1312 support. Below the support, I see no major support until 1.1283. Once that level is broken, then support is located at 1.1256, and 1.1230.
From the recent movement of EUR/USD, the pair has formed a series of lower highs and lower lows. Because of this, the overall trend is down. A break of 1.1283 changes the trend to up, and then 1.1312 is the first major resistance.
The first support I am watching is 1.1283. Expect 1.1256 below. Limit orders to buy are now filled at 1.1312, above which 1.1350 and 1.1373 become key levels.
RSI is near the 30 level and is in the bearish territory, signaling that further declines may be limited. I am bearish and expect downside to the 1.1312/50 area, which is reinforced by a lower trendline, and a bearish channel. A move above the 1.1373 area changes the near-term bias. I shall wait for a break below 1.1283 for another target at 1.1256.


