



SP500 Moves Higher As Non Farm Payrolls Drop To 29,000
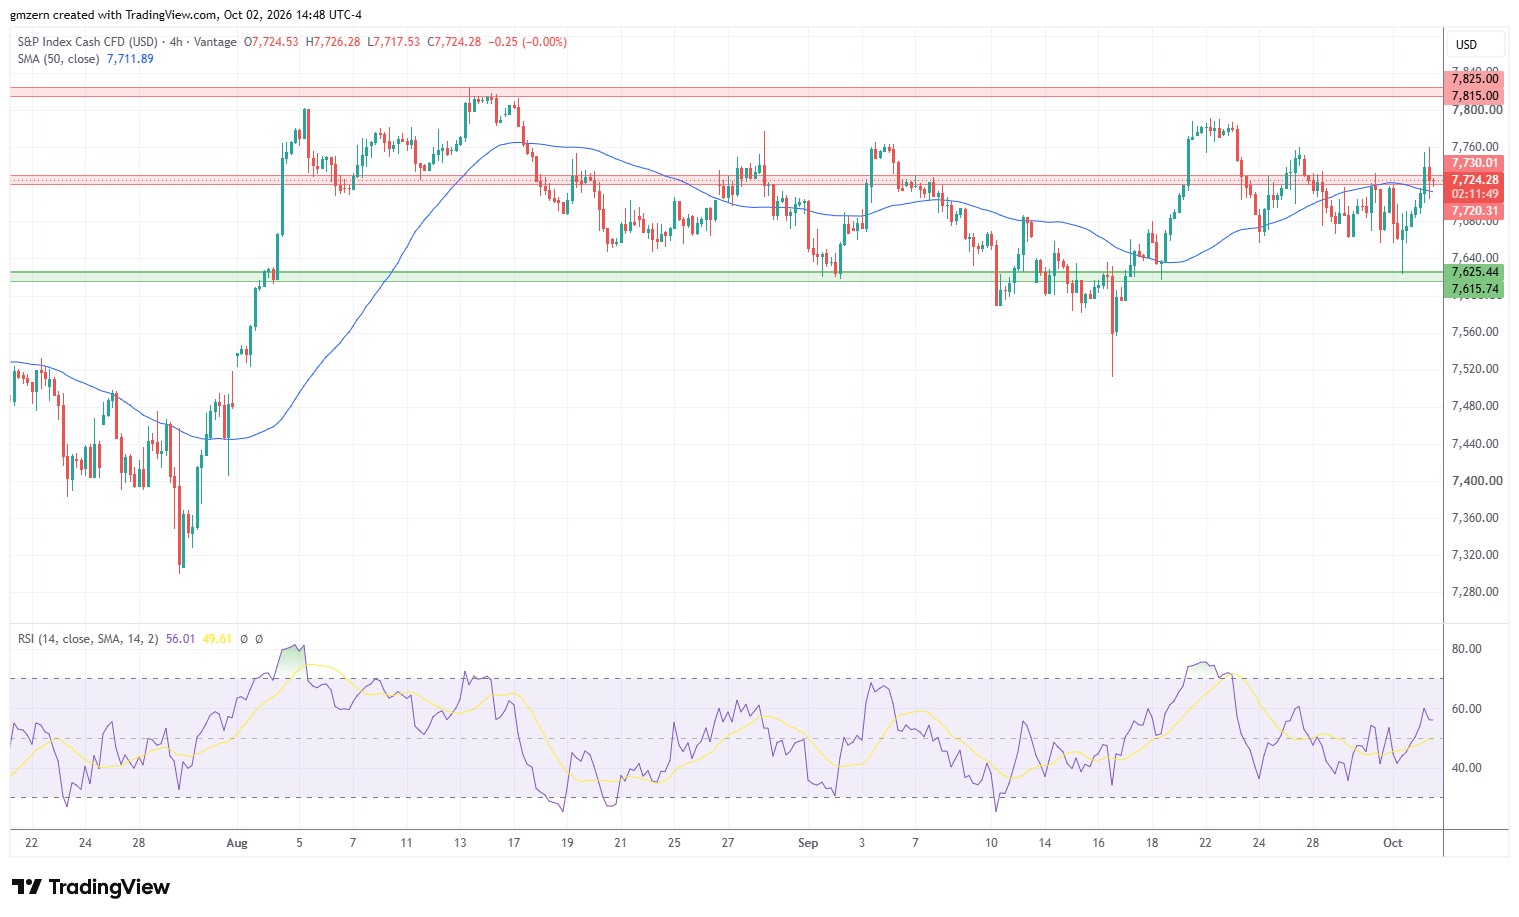
SP500 gains ground as traders focus on the weak Non Farm Payrolls report. The report showed that the U.S. economy added just +29,000 jobs in September, compared to analyst consensus of +90,000. The previous report was revised from +162,000 to +133,000.
Unemployment Rate increased from 4.1% in August to 4.2% in September, compared to analyst consensus of 4.1%. The surprising weakness of job market data served as a positive catalyst for SP500 as traders reduced bets on hawkish Fed.
According to FedWatch Tool, the probability of a rate hike at the meeting in October decreased to 21.6. Traders expect that Fed will raise the federal funds rate by 25 bps at the meeting in December.
Interestingly, Treasury yields moved higher despite weak job market data. The yield of 2-year Treasuries climbed towards the 4.83% level, while the yield of 10-year Treasuries settled above 5.28%. I’d note that rising Treasury yields did not put pressure on the SP500 index today.
Traders also had a chance to take a look at the Factory Orders report for August. The report showed that Factory Orders increased by +0.1% month-over-month, in line with analyst estimates. This report did not have a material impact on market dynamics.
Oil prices rebounded from session lows as traders focused on reports indicating that Saudi Arabia planned to attack Iran-backed Houthis. The militant group controls the Bab-El-Mandeb Strait, and Yemen’s official forces are unable to defeat the Houthis. The potential attack against the Houthis may serve as a major bullish catalyst for oil prices and put pressure on SP500.
Industrials and technology stocks were among the biggest gainers in the SP500 today. Healthcare stocks moved lower as demand for defensive sectors declined.
Currently, SP500 is trying to settle above the resistance level at 7720 – 7730. In case this attempt is successful, SP500 will head towards the next resistance, which is located in the 7815 – 7825 range. RSI is in the moderate territory, so there is plenty of room to gain momentum in the near term.

NASDAQ Tests Historic Highs
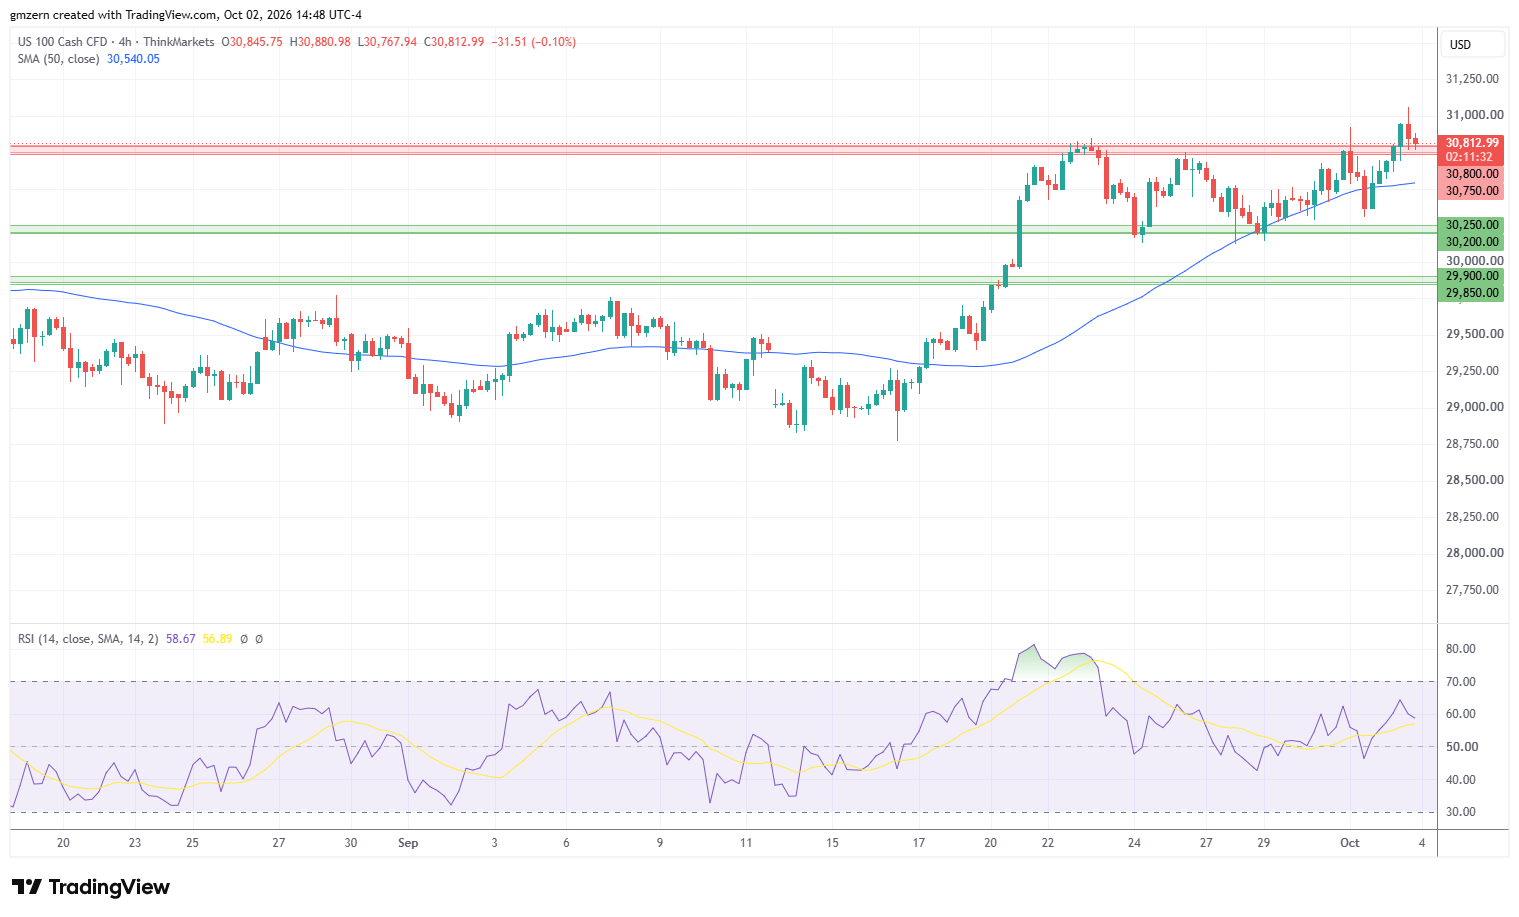
NASDAQ tested new highs as traders focused on the disappointing Non Farm Payrolls report and bet that Fed would not raise rates at the next meeting.
NASDAQ climbed above the resistance level at 30,750 – 30,800 and made an attempt to settle above the 31,000 level. In case NASDAQ manages to settle above 31,000, it will head towards the 31,500 level.
Dow Jones Price Forecast
Every new Dow Jones analysis as it publishes, today's technical signal and key levels, live price — on one page.
See all Dow Jones forecastsDow Jones Gains Ground Despite Rising Treasury Yields
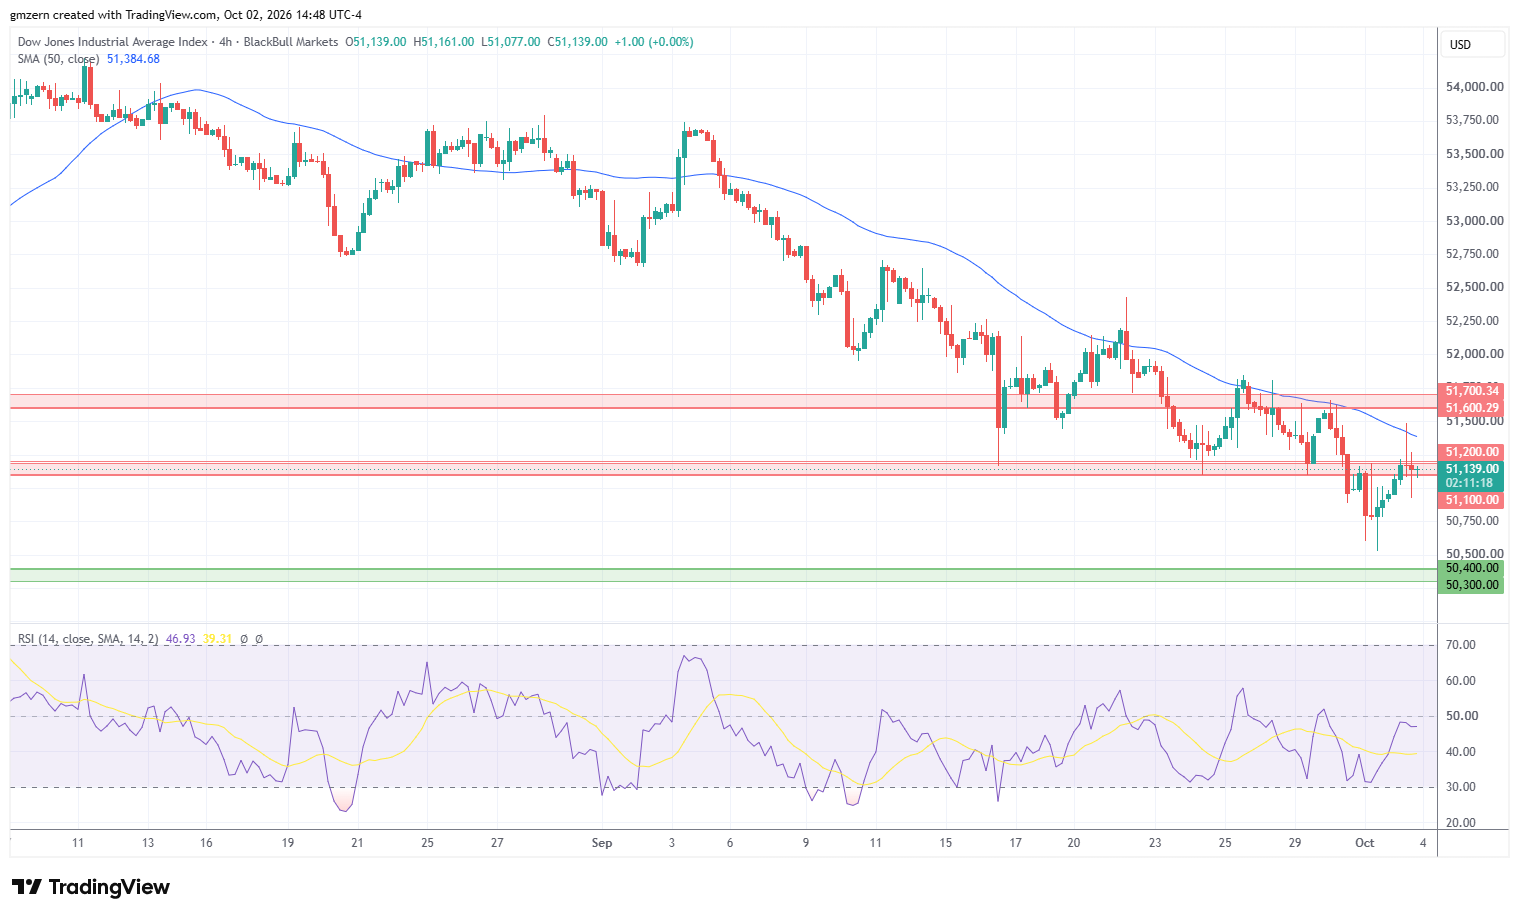
Dow Jones has also managed to gain some ground as traders focused on job market data. However, the rebound in the oil markets put some pressure on the index. Nike, which was down by -4.1%, was the worst performer in the Dow Jones index today. The stock pulled back as traders reacted to the company’s disappointing sales outlook.
If Dow Jones manages to settle above the resistance at 51,100 – 51,200, it will head towards the 50 MA at 51,384. A move above the 50 MA will open the way to the test of the resistance level at 51,600 – 51,700.
For a look at all of today’s economic events, check out our economic calendar.


