
Cheaper Oil Bought Stocks Some Room Before Payrolls
Stock futures are up Friday morning on something other than another AI bet. Oil is coming off hard after European governments started talking about releasing diesel and crude reserves. Inflation pressure eased a bit with it. The long end of the Treasury market finally has a reason not to run away again.
None of that turns the rate trade around. Long yields are still high enough to lean on most of the market, especially the groups without a strong earnings story behind them. On the chart, S&P 500 futures got the 50-day moving average back and ran straight into resistance.
At 11:28 GMT, December E-mini S&P 500 Index futures are trading at 7,762.00, up 38.00 points or +0.49%. Dow futures are up about 0.6% and Nasdaq-100 futures have added roughly 0.7%.
Daily December E-mini S&P 500 Index Futures Technical Analysis
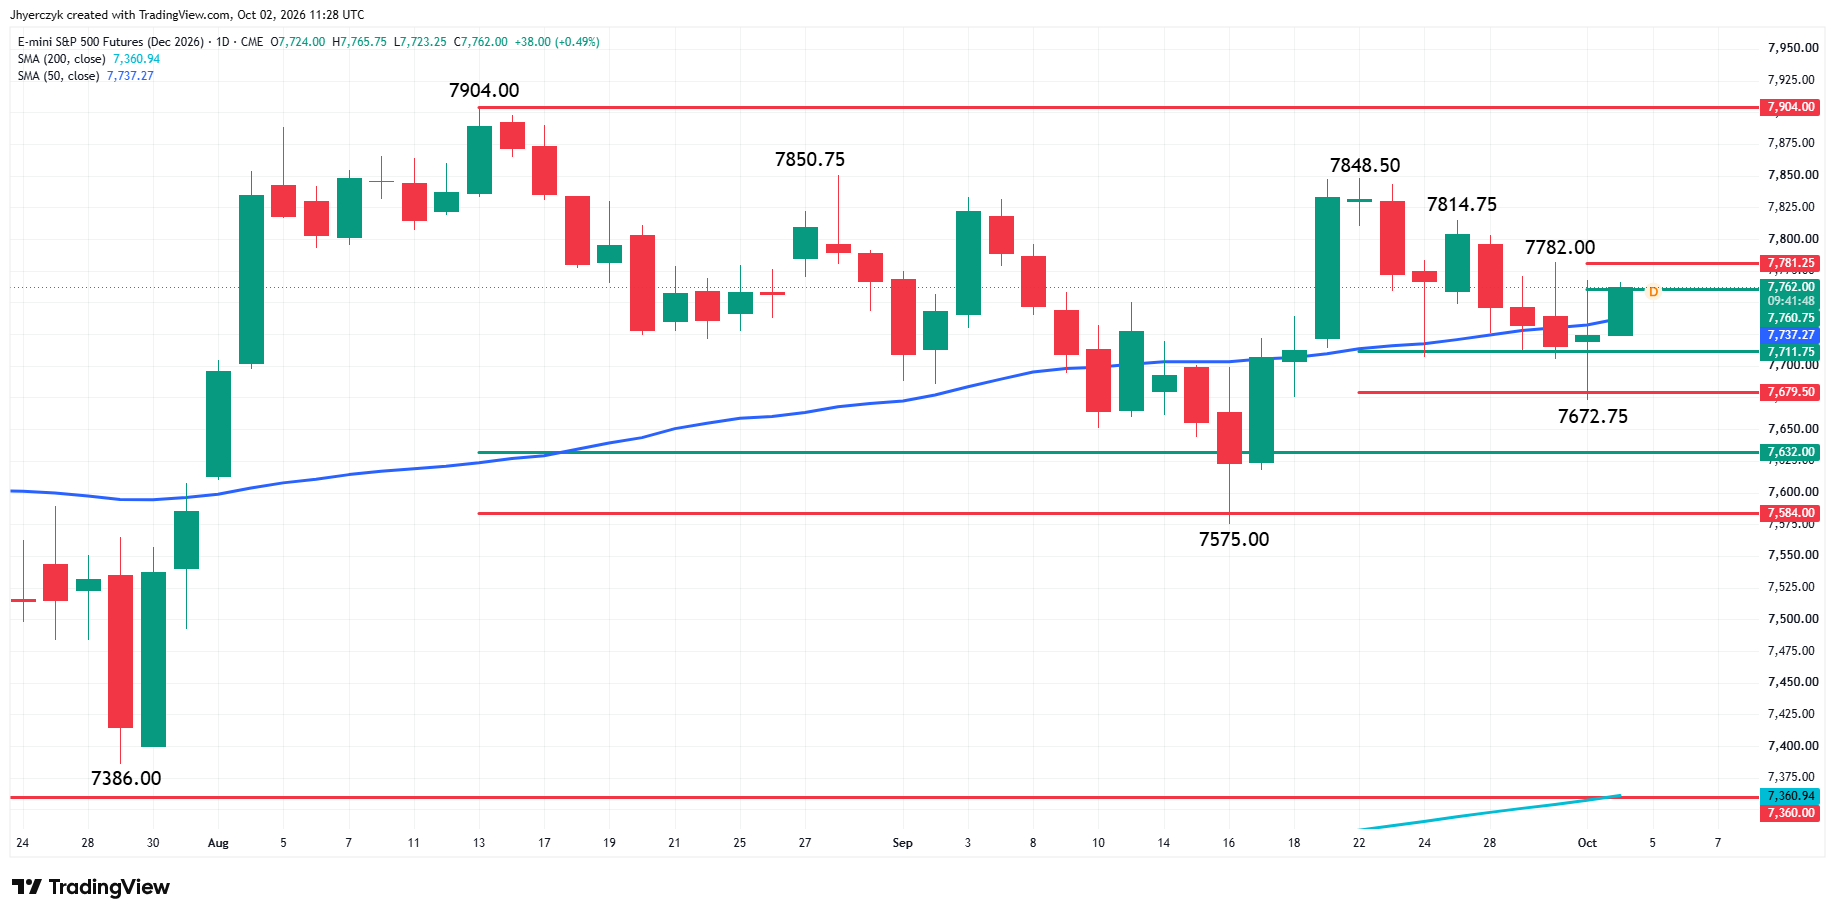
December E-mini S&P 500 Index futures are trading higher early Friday after recapturing the 50-day moving average at 7,737.25.
The main trend is up according to the daily swing chart, however, the minor trend is trending lower.
The main trend will be reaffirmed on a move through 7,848.50. This would put the record high at 7,904.00 back on the radar. A trade through 7,575.00 will change the main trend to down.
The minor trend is down. A trade through 7,782.00 will change the minor trend to up and confirm the shift in momentum to the upside. A trade through 7,672.75 will continue the downtrend.
On the downside, the near-term support zone is 7,711.75 to 7,679.50. This is followed by short-term support at 7,632.00 to 7,584.00.
On the upside, near-term resistance at 7,760.75 to 7,781.25 is currently being tested. A sustained move under the 50% level at 7,760.75 will signal the presence of sellers. A sustained move over the 61.8% level at 7,781.25 will indicate the presence of buyers.
A breakout over 7,781.25 will target minor tops at 7,782.00 and 7,814.75 before challenging the main top at 7,848.50.
Dow Jones Price Forecast
Every new Dow Jones analysis as it publishes, today's technical signal and key levels, live price — on one page.
See all Dow Jones forecastsEurope’s Reserve Talk Knocked Oil Down Fast
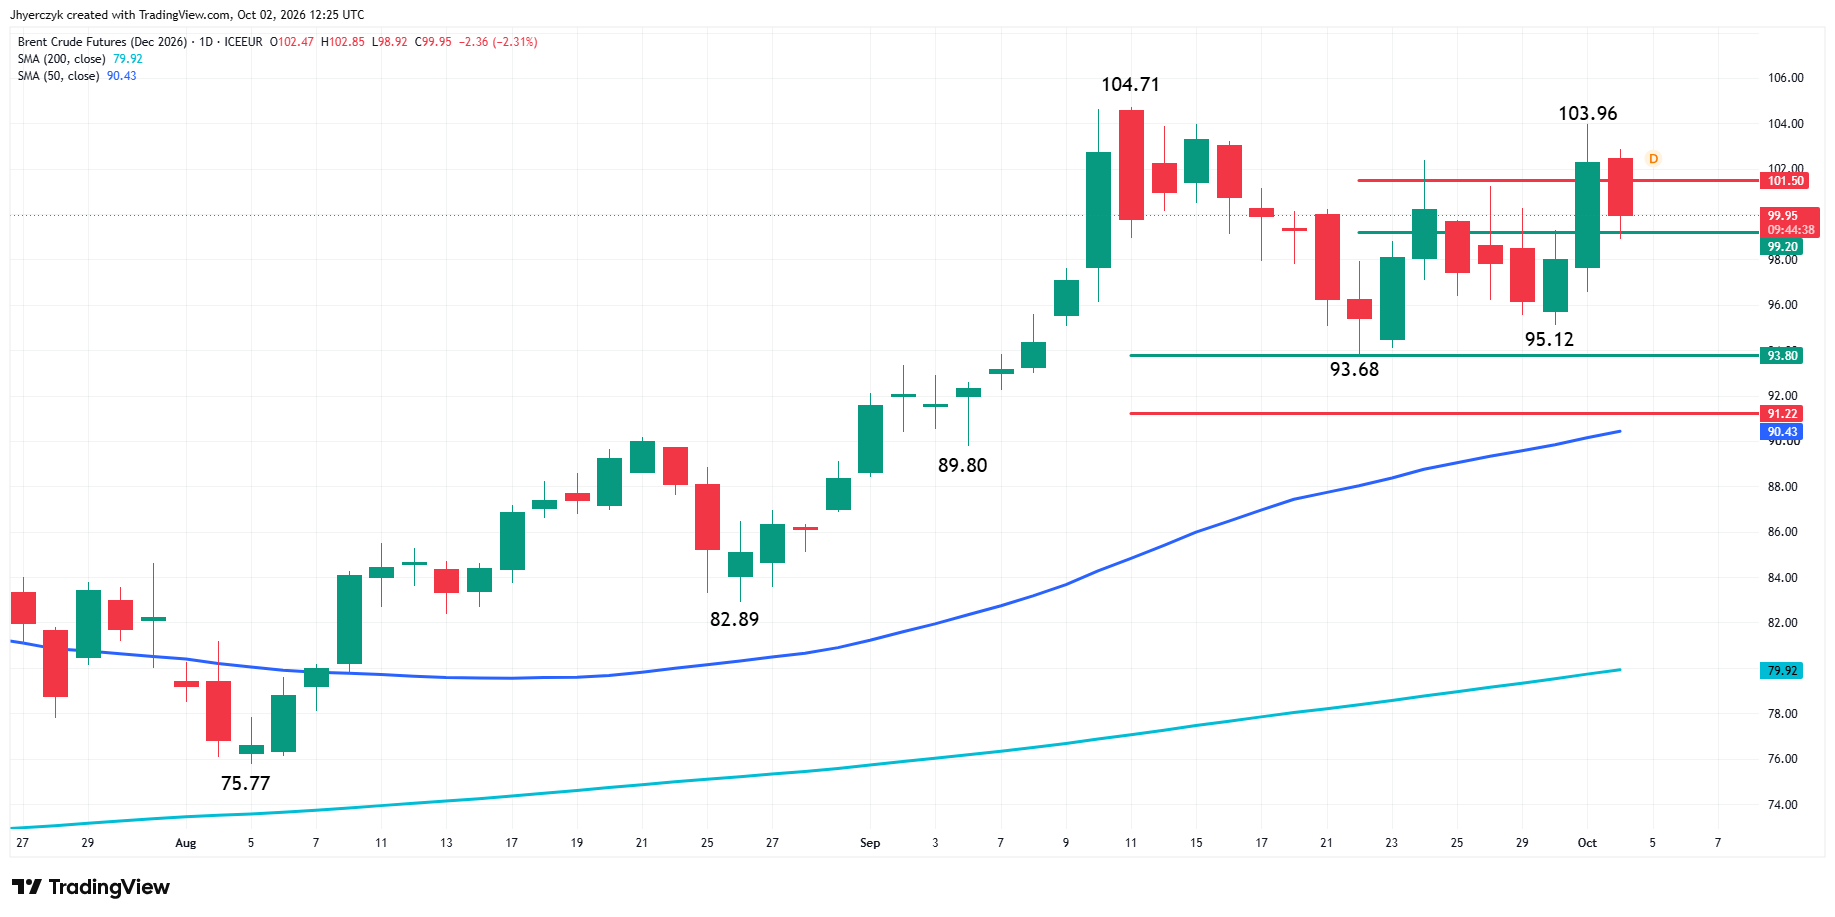
Reserve talk out of Europe was all oil sellers needed. December Brent crude oil futures are near $99 a barrel after dropping more than 2%. November WTI crude oil futures are off closer to 4% near $89. European Union member states are weighing a diesel reserve release with crude stocks on the table too.
The Trump administration has been leaning on European allies to get fuel moving. A strategic release puts product into a market that’s been tight since refinery and shipping problems hit the Middle East and Russia. Nobody should be surprised oil came down as fast as it did.
Equities needed that. Thursday showed what happens without it. The 10-Year ran up to 5.344%, its highest since 2002, then turned around. Stocks never got a broad rally out of the drop because the yield move had already done its damage.
Stocks can work with cheaper oil. Bond sellers get one less reason to press.
Long Yields Are Still Too High for a Broad Rally
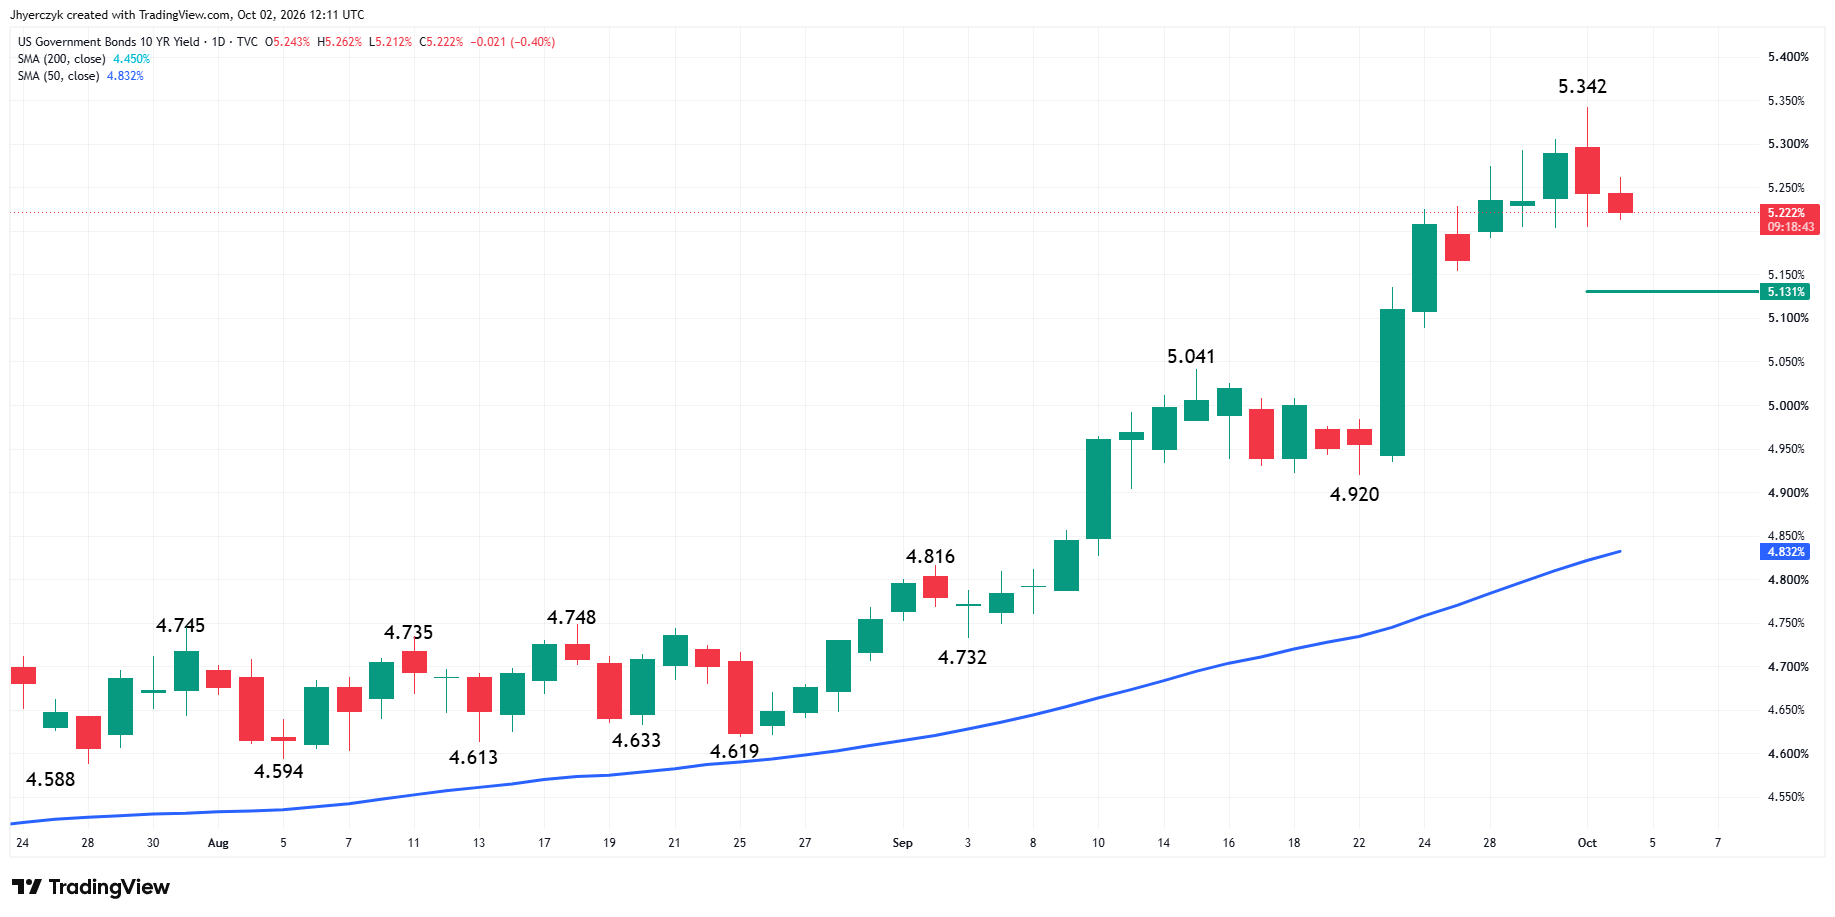
The 10-Year is still near 5.22% and the 30-Year is near 5.59%, close to levels from more than two decades ago. Deficits and Treasury supply didn’t go anywhere because oil dipped. Neither did the yield it takes to get buyers into long-dated debt.
Friday looks like a relief trade to me. The inflation risk is still on the table. The groups that need yields to cooperate, the ones without an earnings story to carry them, are the ones still waiting.
Payrolls Decides Whether the Long End Gets Its Break
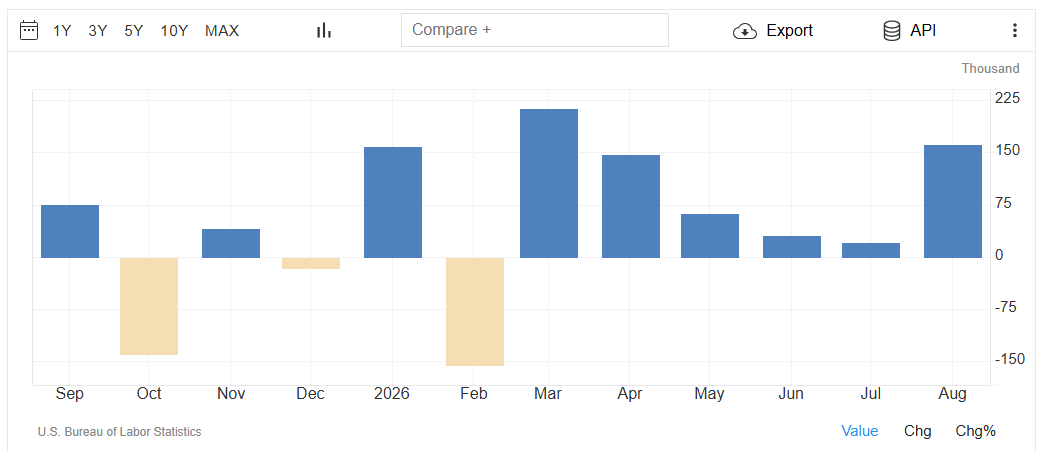
The morning comes down to September’s Non-Farm Payrolls report. Economists are looking for 84,000 jobs with unemployment holding at 4.1%.
CME FedWatch has the odds of the Fed standing pat in October near 72%. The softer PCE report already took the urgency out of that meeting. A steady labor market lets policymakers wait even on a firm print.
Stocks don’t get a free pass from it. Jobless claims came in under expectations earlier in the week and ISM prices jumped. Thursday’s high on the 10-Year isn’t far away. Bond buyers haven’t seen anything since PCE that says the economy is cooling enough to ease up on the long end.
Moderna Gets an Index Lift as Nike Slides on Its Miss
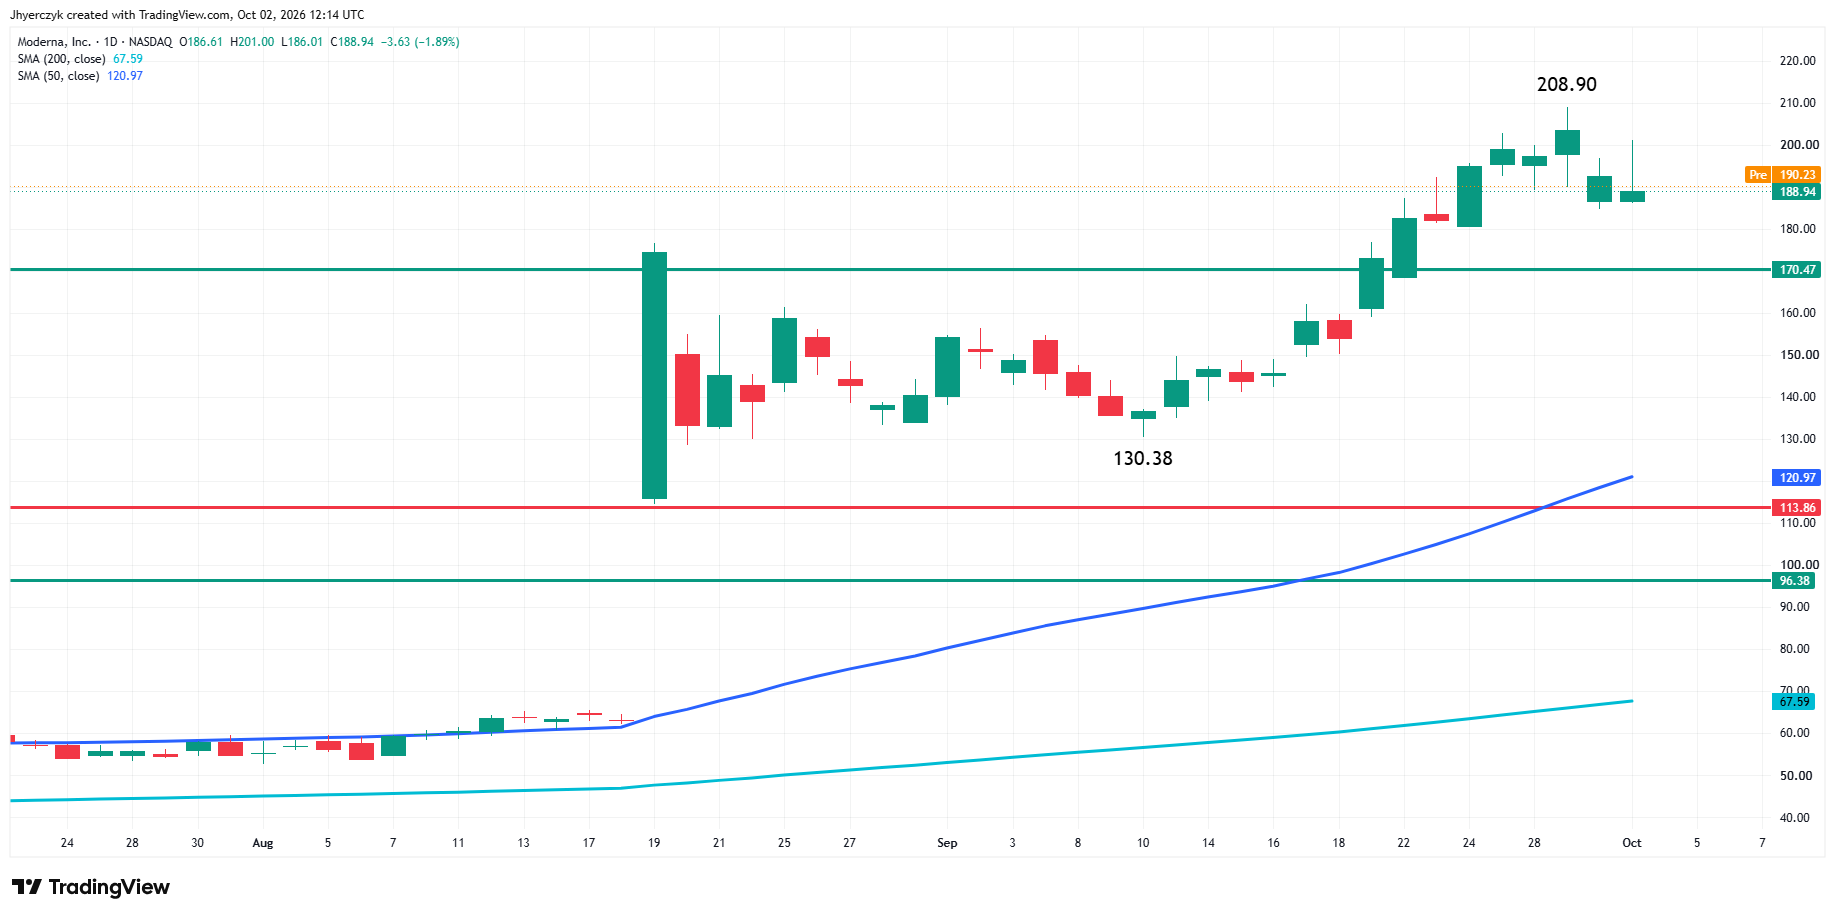
Moderna is higher premarket after Nasdaq said it will replace Warner Bros. Discovery in the Nasdaq-100 before the October 9 opening. The stock’s had a big year on positive cancer-vaccine trial data. Now index funds have to make room for it.
Nike is sliding after missing earnings and revenue estimates. Then came the restructuring, layoffs next year included. The company sees fiscal 2027 revenue falling by a high-single-digit percentage. China is still the sore spot. Nike brand revenue there fell 26%.
What to Watch
Payrolls lands on a market with cheaper oil working for it and a 10-Year that’s still elevated. Moderna shows a few growth names can still find buyers. Friday’s bid reaching rate-sensitive stocks comes down to what the long end does after the jobs number.
The lean is bullish. December E-mini S&P 500 Index futures got the 50-day moving average at 7,737.25 back early Friday and the main trend on the swing chart is still up. Now the contract is jammed into the 7,760.75 to 7,781.25 resistance zone before the cash open. Whatever traders do with that zone sets the session’s tone. The minor trend is still down, with the 7,782.00 minor top sitting right on top of the zone.
More Information in our Economic Calendar.