
SP500 Moves Away From Historic Highs
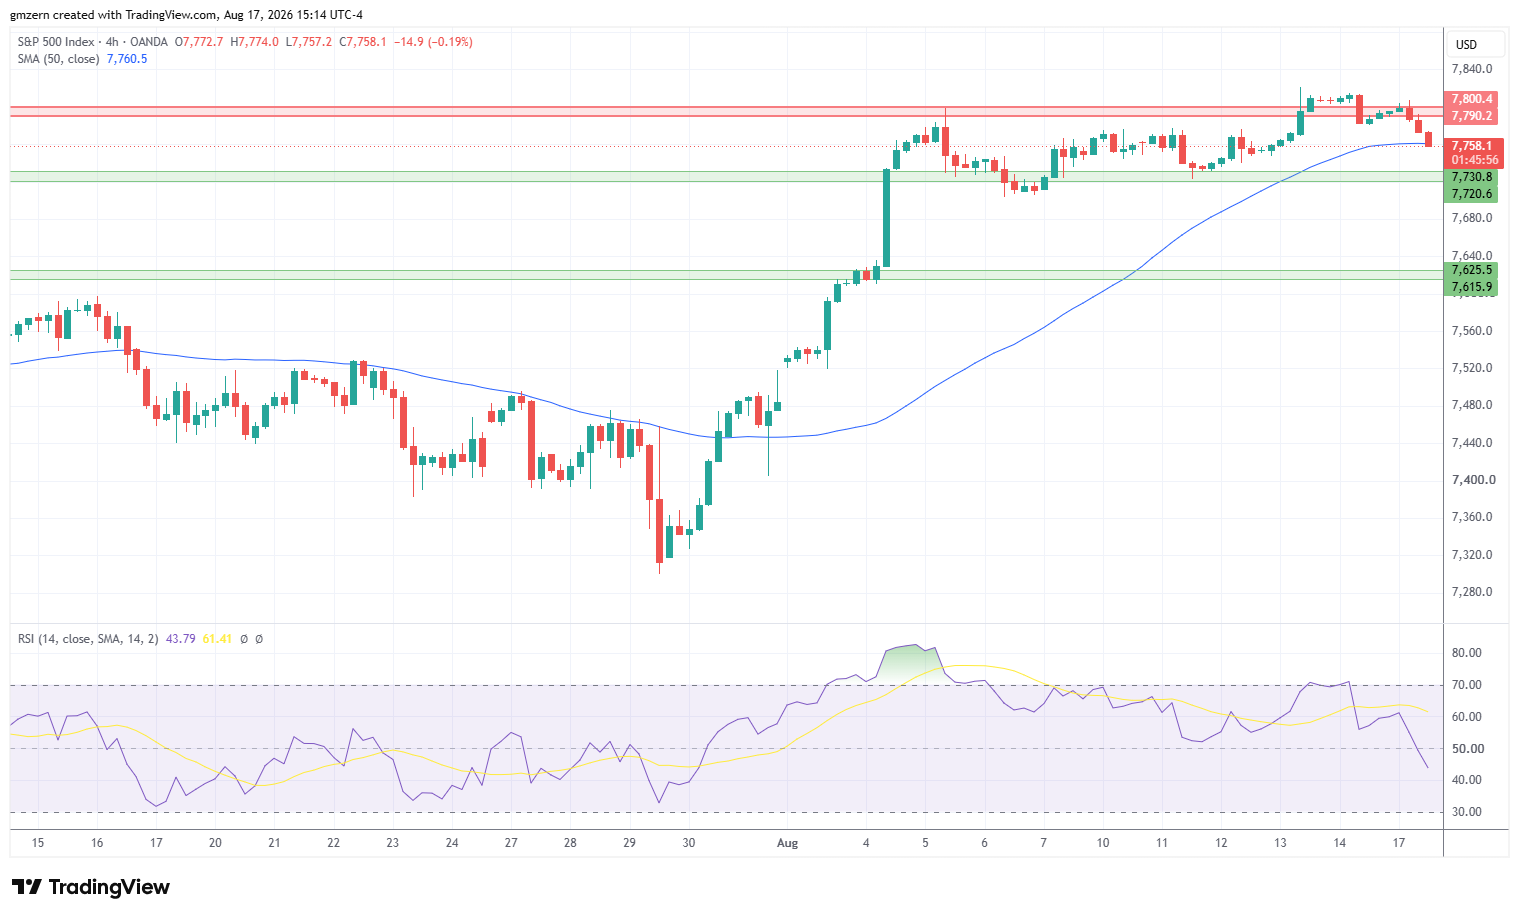
SP500 is losing ground as traders focus on Middle East tensions and rising Treasury yields.
Oil prices are up by +2.5% as President Trump said that he was in no hurry for Iran deal. Oil traders also focused on rising tensions in Lebanon and Gaza. In addition, Houthis have recently attacked ships in the Red Sea.
Treasury yields moved higher as bond traders focused on rising oil prices. The yield of 2-year Treasuries climbed above the 4.18% level, while the yield of 10-year Treasuries settled above 4.72%. Importantly, the yield of 30-year Treasuries tested multi-decade highs and climbed above the 5.30% level.
Today, traders also had chance to take a look at the NAHB Housing Market Index report. The report indicated that NAHB Housing Market Index improved from 34 in July to 35 in August, compared to analyst consensus of 33. According to NAHB, high construction costs and broader economic uncertainty continue to put pressure on builder sentiment.
Not surprisingly, energy stocks were among the biggest gainers today as traders focused on the rally in the oil markets. Rising precious metals markets provided support to basic materials stocks. Consumer defensive and communication services stocks were among the biggest losers today. Real estate stocks also moved lower as Treasury yields increased.
Currently, SP500 is trying to settle below the 50 MA at 7760. In case this attempt is successful, SP500 will head towards the nearest support, which is located in the 7720 – 7730 range. A move below the 7720 level will open the way to the test of the next support at 7615 – 7625.

NASDAQ Moves Lower Amid Profit-Taking
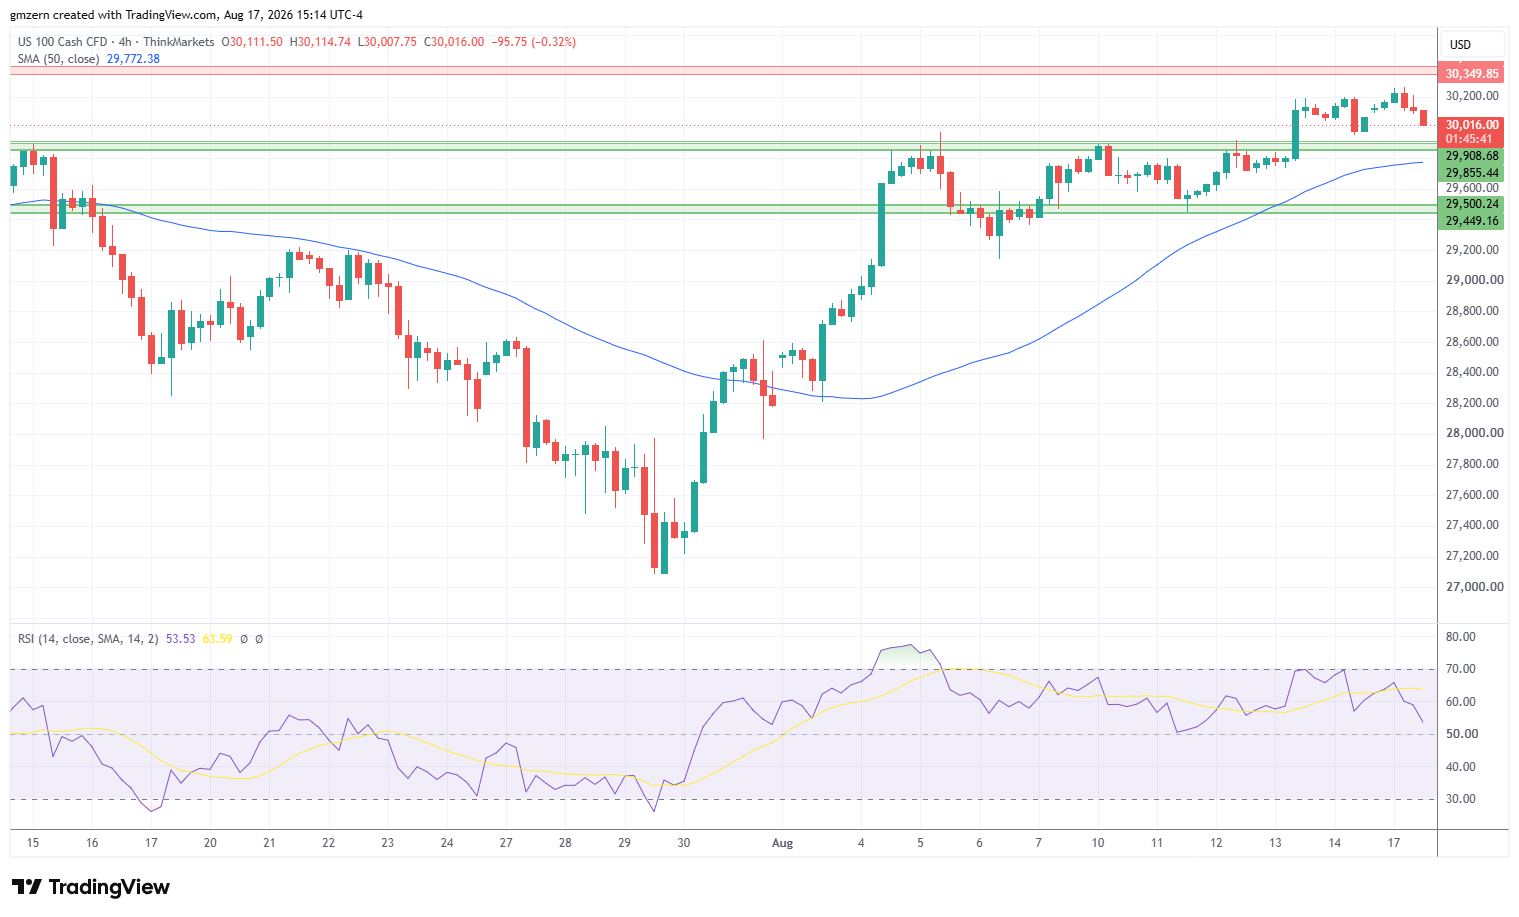
NASDAQ pulled back despite the strong rally in Sandisk stock. The stock rallied 8% amid reports indicating that U.S. administration asked domestic tech companies to avoid buying memory chips from Chinese suppliers. Micron, Western Digital, and Seagate also gained ground on the news.
The nearest support level for NASDAQ is located in the 29,850 – 29,900 range. If NASDAQ declines below the 29,850 level, it will head towards the 50 MA at 29,772. In case NASDAQ pulls back below the 50 MA, it will move towards the next support at 29,450 – 29,500.
On the upside, NASDAQ needs to settle above the resistance at 30,350 – 30,400 to have a chance to gain upside momentum in the near term.
Dow Jones Price Forecast
Every new Dow Jones analysis as it publishes, today's technical signal and key levels, live price — on one page.
See all Dow Jones forecastsDow Jones Tests Support At 53,300 – 53,400
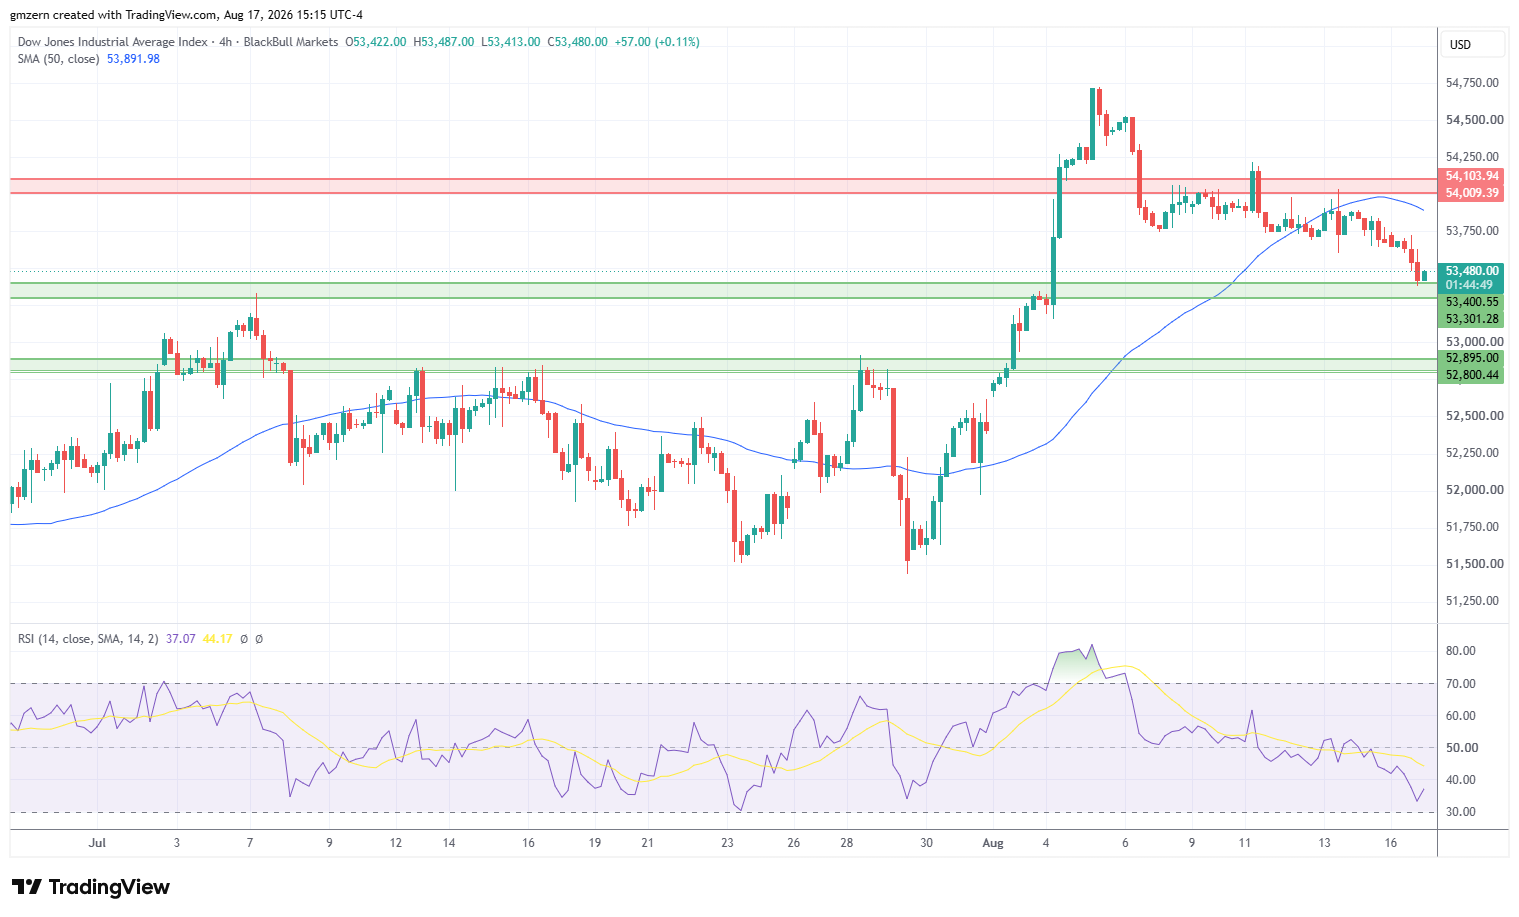
Dow Jones is losing ground as traders focus on rising oil prices. Microsoft, which is down by -3%, is among the biggest losers in the Dow Jones index today. The stock is under pressure as traders take some profits off the table after the recent rally.
From the technical point of view, Dow Jones attempts to settle below the support level at 53,300 – 53,350. If Dow Jones manages to settle below the 53,300 level, it will head towards the next support, which is located in the 52,800 – 52,850 range. RSI is in the moderate territory, so there is enough room to gain additional downside momentum in the near term.
On the upside, a move above the resistance at 54,000 – 54,100 will push Dow Jones towards the 54,700 level.
For a look at all of today’s economic events, check out our economic calendar.