



The most recent movements are very technical, and it seems like nothing here is happening without a reason.
The new long-term highs for Gold
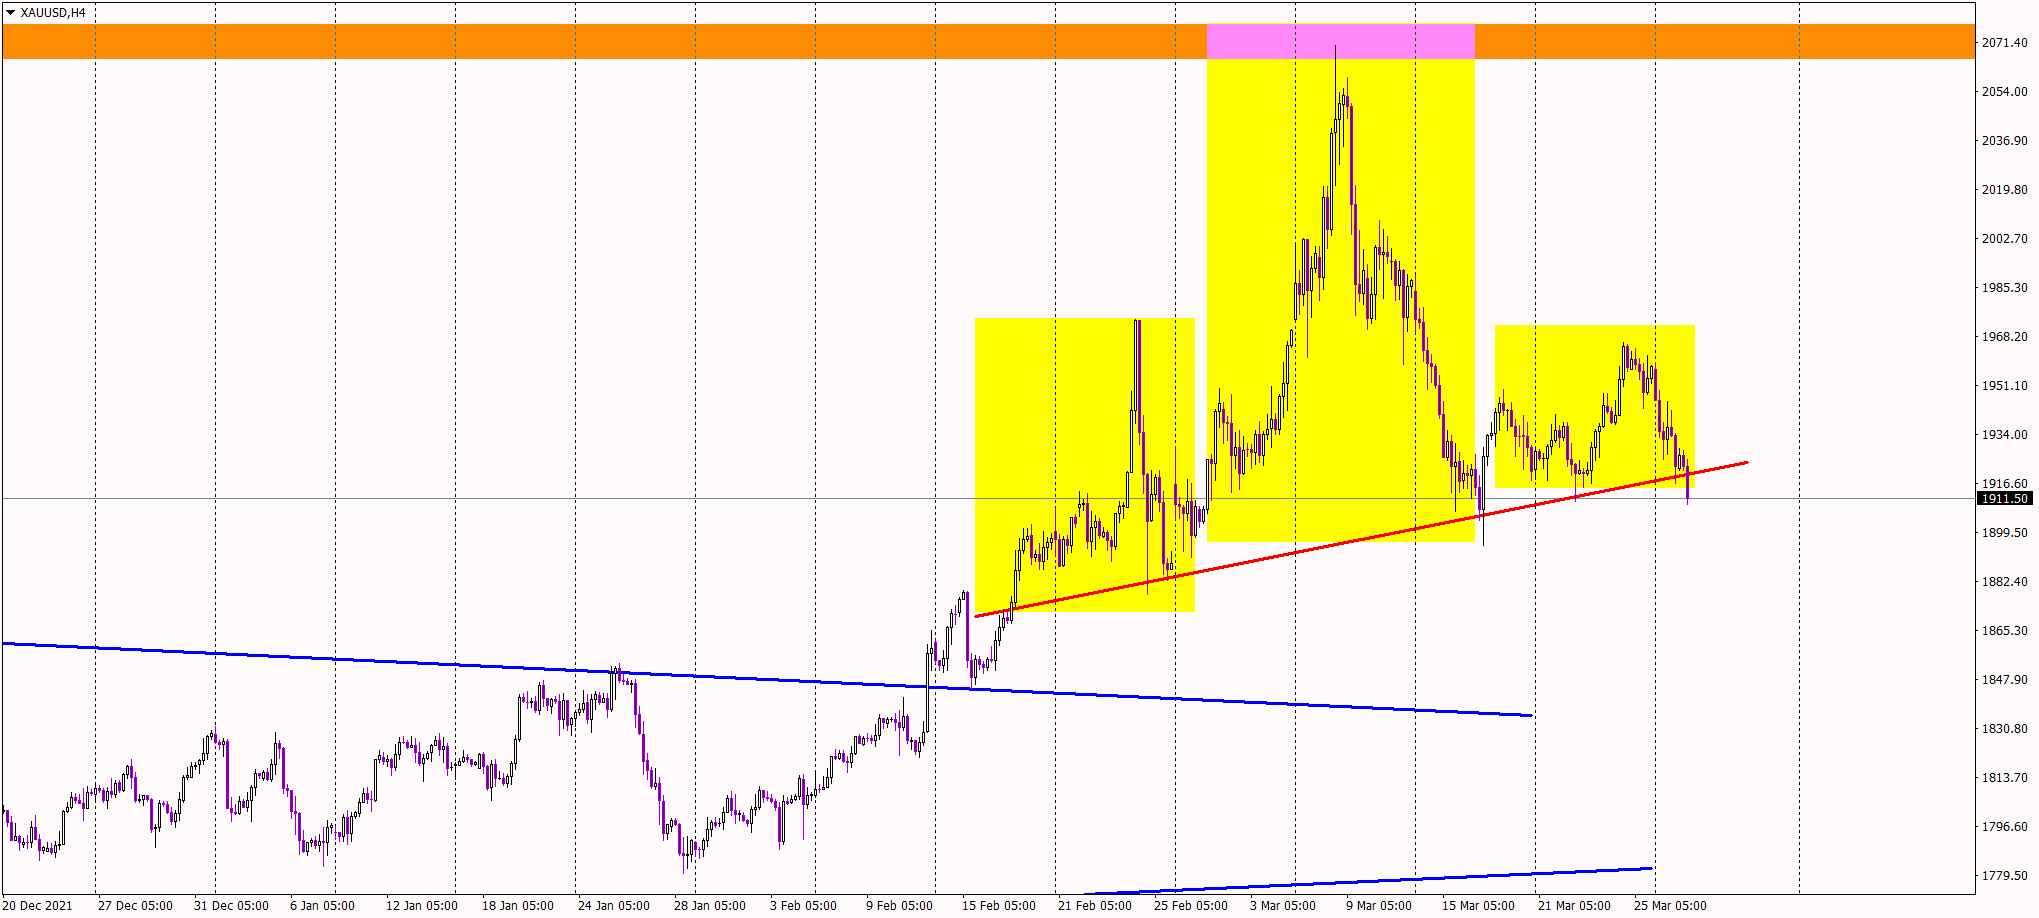
First, let’s come back to the beginning of March. The price was surging and on March 8th it managed to set new long-term highs on 2070 USD/oz. That was very close to the all-time high gold reached back in August 2020, so you can imagine the strength of this resistance.
The price reaching this resistance was a great reason to capture some profits. It was a good idea for local sellers but also for the buyers because it’s always helpful to cool down the indicators, which were screaming that the precious metal is in the overbought state.
Although a small bearish correction would be healthy, traders took it up a notch and instead of a correction, it we’re currently seeing a full-scale reversal. Gold managed to create a head and shoulders pattern (yellow) and remember, it’s happening in a crucial place – just below a major resistance. The H&S has a neckline (red) and this neckline is under fire today.
What is happening now?
Gold is currently trying to break the red line and once the sellers succeed in doing that, we’ll be able to claim a bearish victory and witness the birth of a major mid-term sell signal. Remember that the breakout is not a fact yet. To confirm this, we need to see the daily candle closing below the red line. So far, so good but today will be crucial and the aftermath of Tuesday’s trading will have a chance to show us a direction for the next few weeks.
For a look at all of today’s economic events, check out our economic calendar.