Gold markets went sideways during the session on Wednesday, breaking above the $1275 level eventually. That being the case, the market found resistance
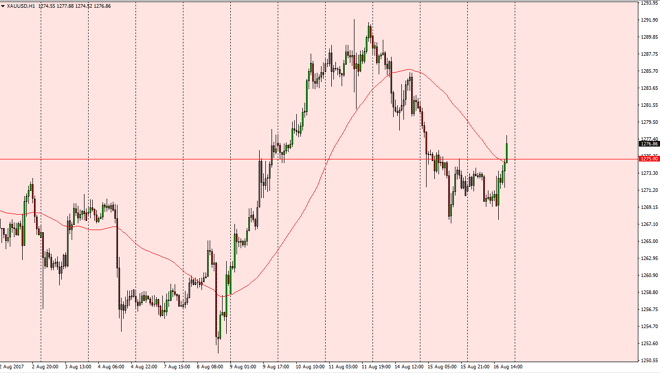
Gold markets went sideways during the session on Wednesday, breaking above the $1275 level eventually. That being the case, the market found resistance above there, and I think that the short-term pop will more than likely find sellers. I believe that a move to the $1265 level is probably the next move, and then perhaps even down to the $1250 level. This will be especially true if the Federal Reserve looks hawkish in the meeting minutes, which is more likely than not. I have no interest in buying gold, and I think that the $1290 level above could be an excellent selling opportunity as well if we do get a short-term rally.
Chris is a proprietary trader with more than 20 years of experience across various markets, including currencies, indices and commodities. As a senior analyst at FXEmpire since the website’s early days, he offers readers advanced market perspectives to navigate today’s financial landscape with confidence.