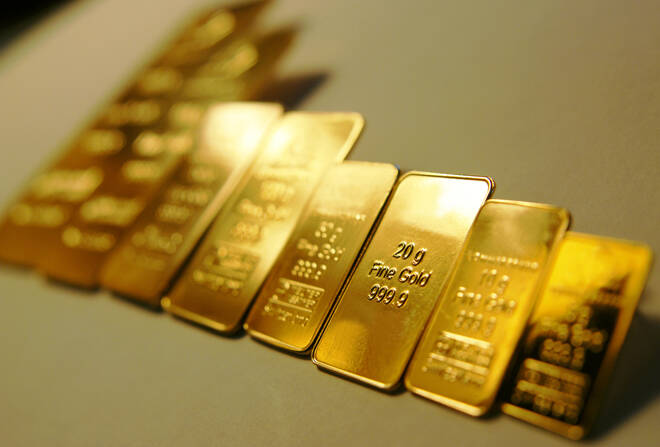
Gold rallied 27% over 12-months during the SARS virus epidemic
Gold prices edged higher but were buoyed as riskier assets sold off following news of a new virus hitting China. The last time the world saw this kind of virus in Asia, known as SARS, gold prices rallied more than 27% over the next 12-months from March 2003 to March 2004. The spread of a new illness that can be pass from person to person hammered Asian stock prices helping to buoy gold. The first case of the coronavirus originating in China can be confirmed in Washington State. The BOJ had its monetary policy decision keeping rates unchanged.
Trade gold with FXTM
Gold prices moved sideways on Tuesday and continue to form a cup and saucer continuation pattern. This is generally a pause that refreshes higher. Short-term support is seen near the 10-day moving average at 1,555. Resistance is seen near the January highs at 1,611. Short-term momentum has turned positive as the fast stochastic generated a crossover buy signal. The trajectory of the fast stochastic is flattish, which also means potential consolidation. The relative strength index (RSI) is moving sideways to lower also reflecting consolidation. Medium-term momentum has turned negative as the MACD (moving average convergence divergence) index generated a crossover sell signal. This occurs as the MACD line (the 12-day moving average minus the 26-day moving average) crosses above the MACD signal line (the 9-day moving average of the MACD line). The MACD histogram is printing in the red with a declining trajectory which points to lower prices.
The Bank of Japan’s kept rates unchanged. Growth forecasts were lifted by 0.2% to 0.8% for 2019 and 0.9% for 2020. CPI forecasts were shaved by 0.1% to 0.5% and 0.6% 2019 and 2020. Two governors dissented which were Kataoka and Harada against the decision to leave the yield curve target unchanged.
David Becker focuses his attention on various consulting and portfolio management activities at Fortuity LLC, where he currently provides oversight for a multimillion-dollar portfolio consisting of commodities, debt, equities, real estate, and more.