


NASDAQ 100 Technical Analysis
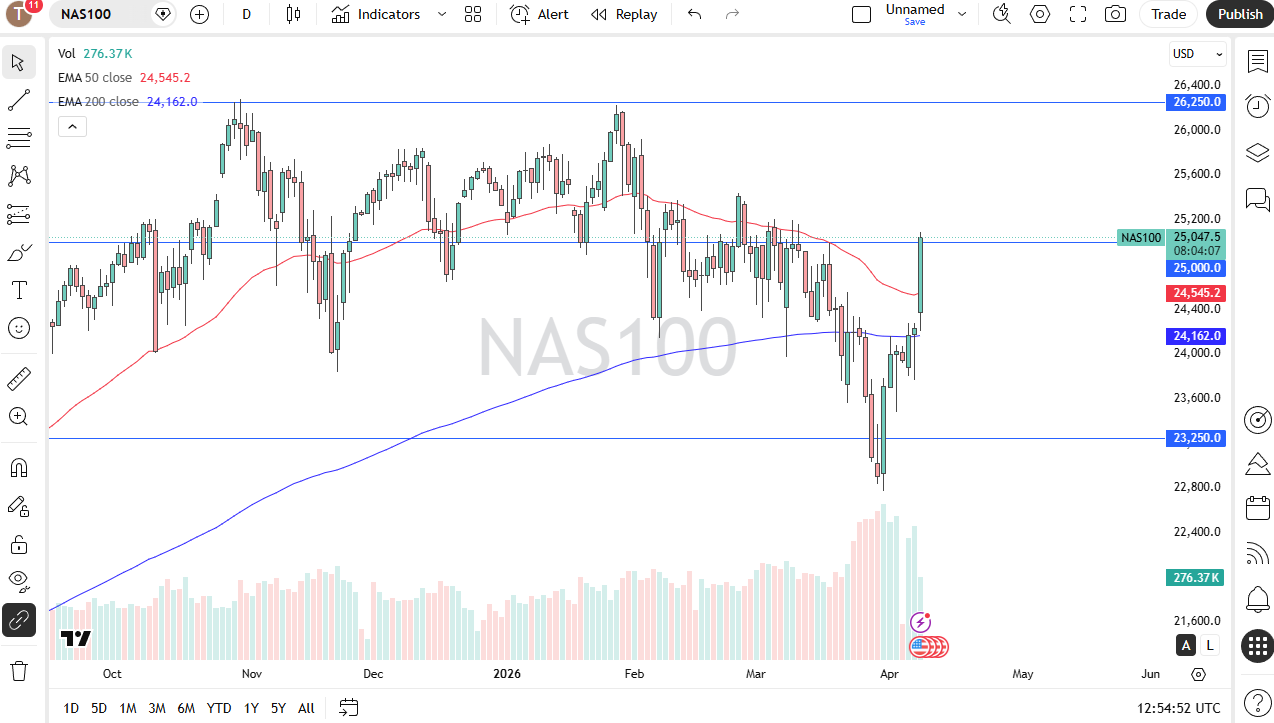
The Nasdaq 100 has broken above the crucial 25,000 level in premarket trading as the ceasefire, of course, has excited everybody. Ultimately, this is a major turn of events for risk appetite and in this environment, it does make a certain amount of sense that we would go much higher.
That being said, we are already 3.34% higher as we hit the 9:00 hour in New York, meaning that we are stretched to say the least. I would expect a short-term pullback at one point or another, probably near the opening that could offer a buying opportunity. Pay attention to the 10-year yields; 4.30% has been violated to the downside, but if we were to jump back above there, it would cause chaos in the Nasdaq 100.
Dow Jones 30 Technical Analysis
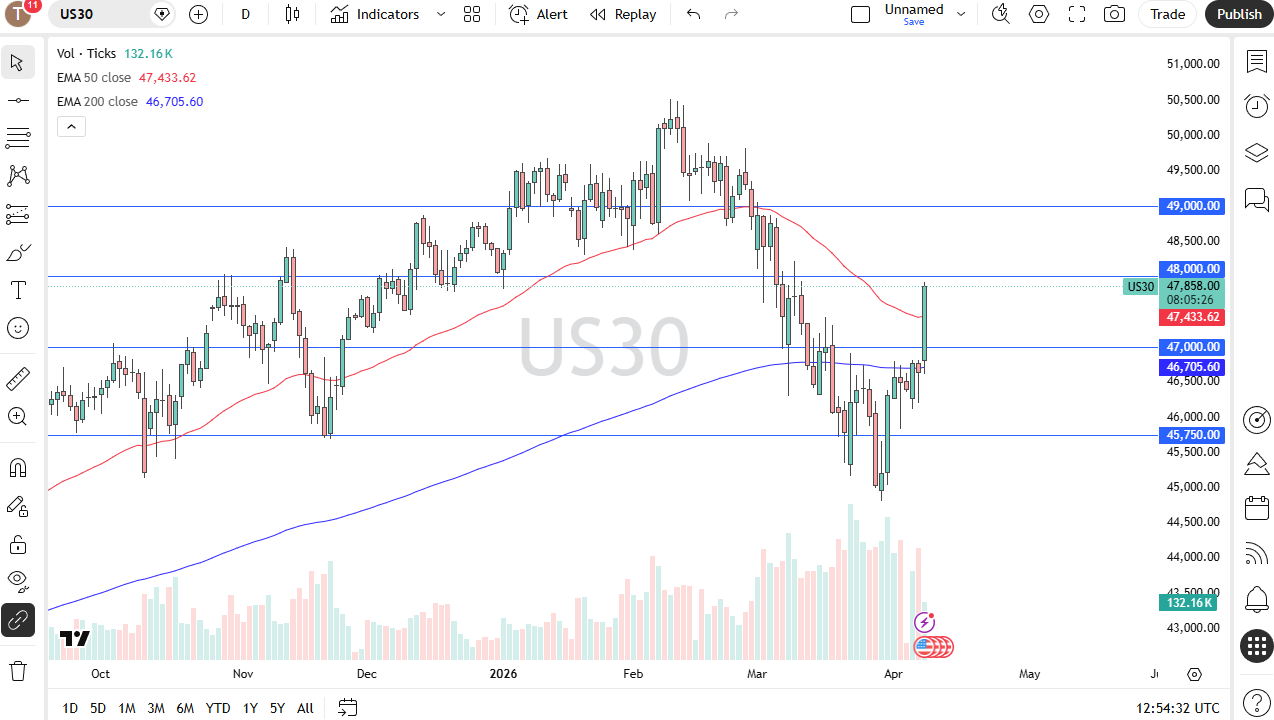
The Dow Jones 30 looks like it is doing everything it can to reach the 48,000 level, an area that has a certain amount of psychology attached to it, but I think it’s also an area that makes sense for some options barriers. Short-term pullbacks here would be a buying opportunity as well, and I believe that somewhere right around 47,000 to the 200-day EMA just below there is your short-term floor. I do expect this market to go higher though.
S&P 500 Technical Analysis
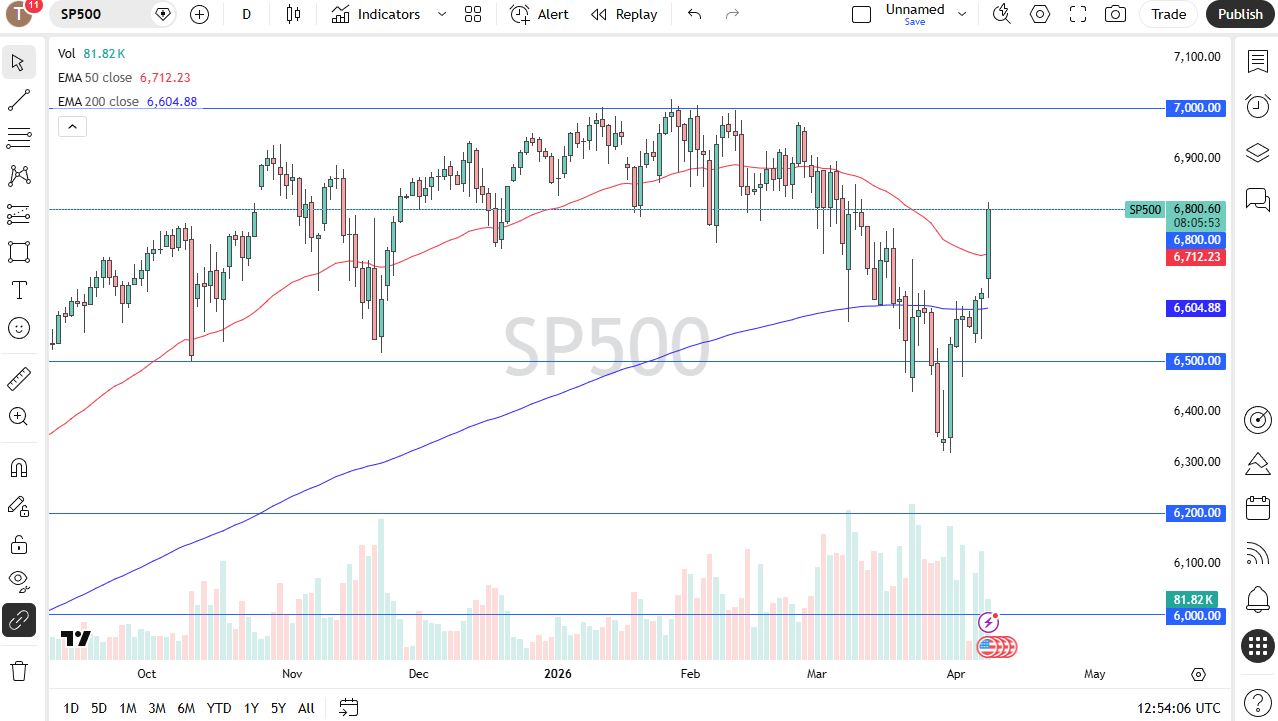
The S&P 500 finds itself testing the 6800 level pretty early. We’ll see if it holds. That was a massive floor in the market before the war started, so getting back above there means we have taken out most of the losses from the war, almost all of them for that matter, and that would be very telling. At that point, I would think you have to assume we will eventually go looking into the 7000 level. Between now and then, short-term pullbacks for me are buying opportunities with the 200-day EMA serving as a floor for the time being.
NASDAQ 100 Price Forecast
Every new NASDAQ 100 analysis as it publishes, today's technical signal and key levels, live price — on one page.
See all NASDAQ 100 forecastsIf you’d like to know more about chart patterns and how to trade them, please visit our educational area.