The natural gas markets initially fell on Monday, but turned around to form a hammer. The hammer forms a significant bullish sign; I think that the $3
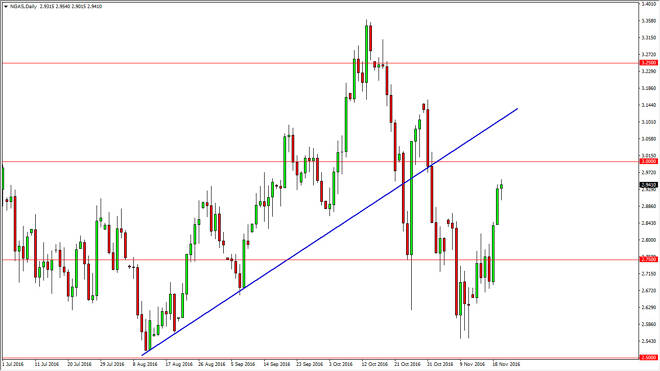
The natural gas markets initially fell on Monday, but turned around to form a hammer. The hammer forms a significant bullish sign; I think that the $3 level above is where massive amounts of resistance will be found. Because of this, an exhaustive candle should be an opportunity to start selling a market that has been struggling for some time. It is getting cold though, so demand could pick up but the supply is so strong that it’s likely we will continue to struggle over the longer term, and thus I’m waiting for an opportunity to short.
Chris is a proprietary trader with more than 20 years of experience across various markets, including currencies, indices and commodities. As a senior analyst at FXEmpire since the website’s early days, he offers readers advanced market perspectives to navigate today’s financial landscape with confidence.