Multi-Stage Recovery from Lows
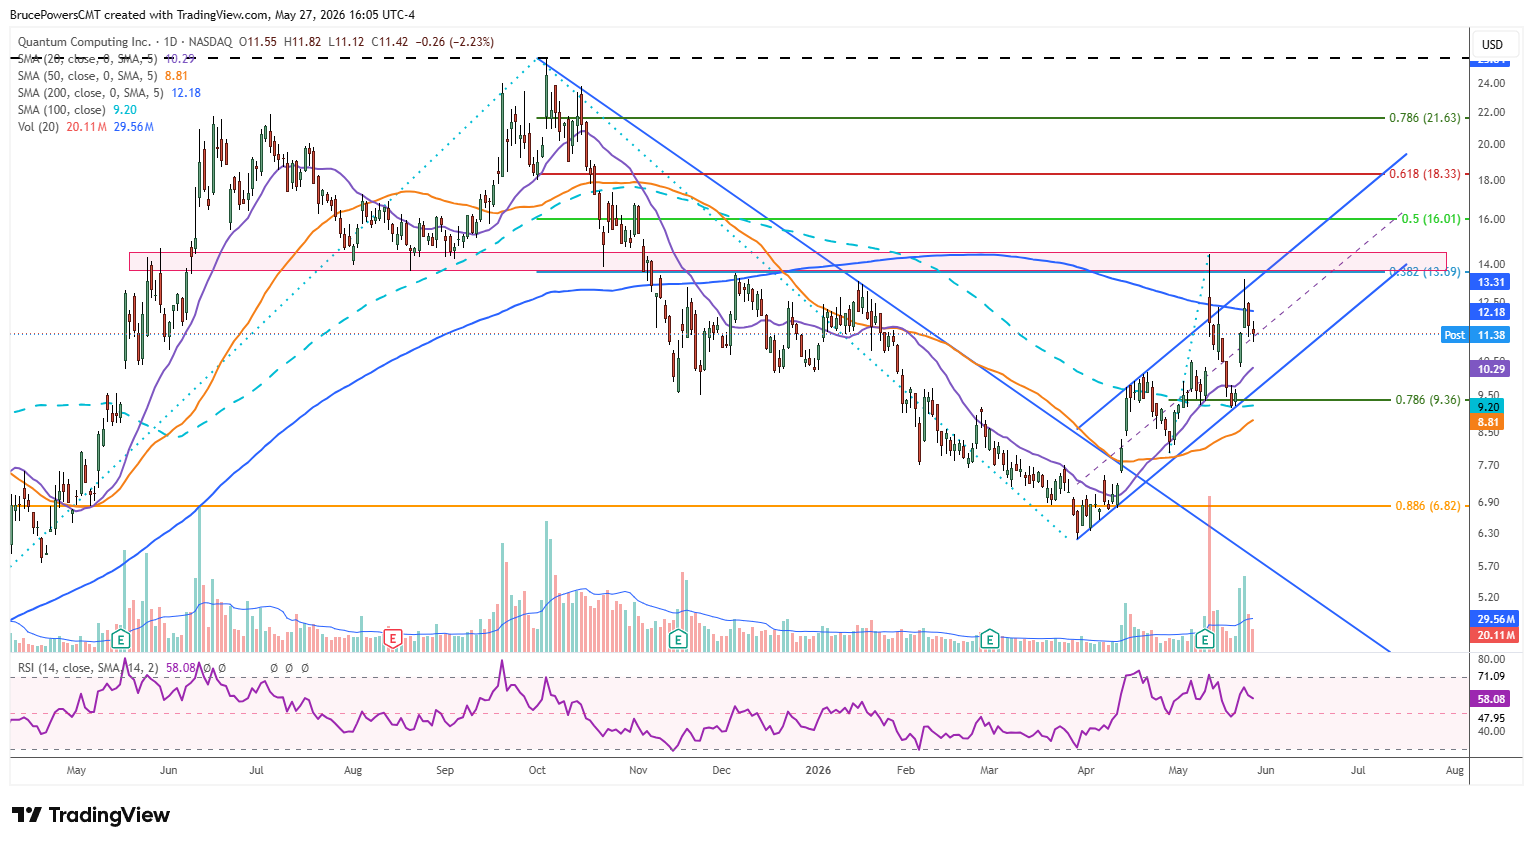
The stock of Quantum Computing Inc. (QUBT) has been testing a key resistance zone recently near the 200-day moving average. Following a corrective low of $6.18 in late-March, QUBT has shown strength by triggering a trendline breakout and reclaiming the 50-day moving average, then subsequently reclaiming the 100-day moving average. It remains in a near-term uptrend supported by the 20-day moving average for short-term momentum and the 100-day moving average for a longer-term view. The U.S.-based company is focused on integrated photonics and quantum-related hardware and software products.

Building Overhead Supply Near Key Range
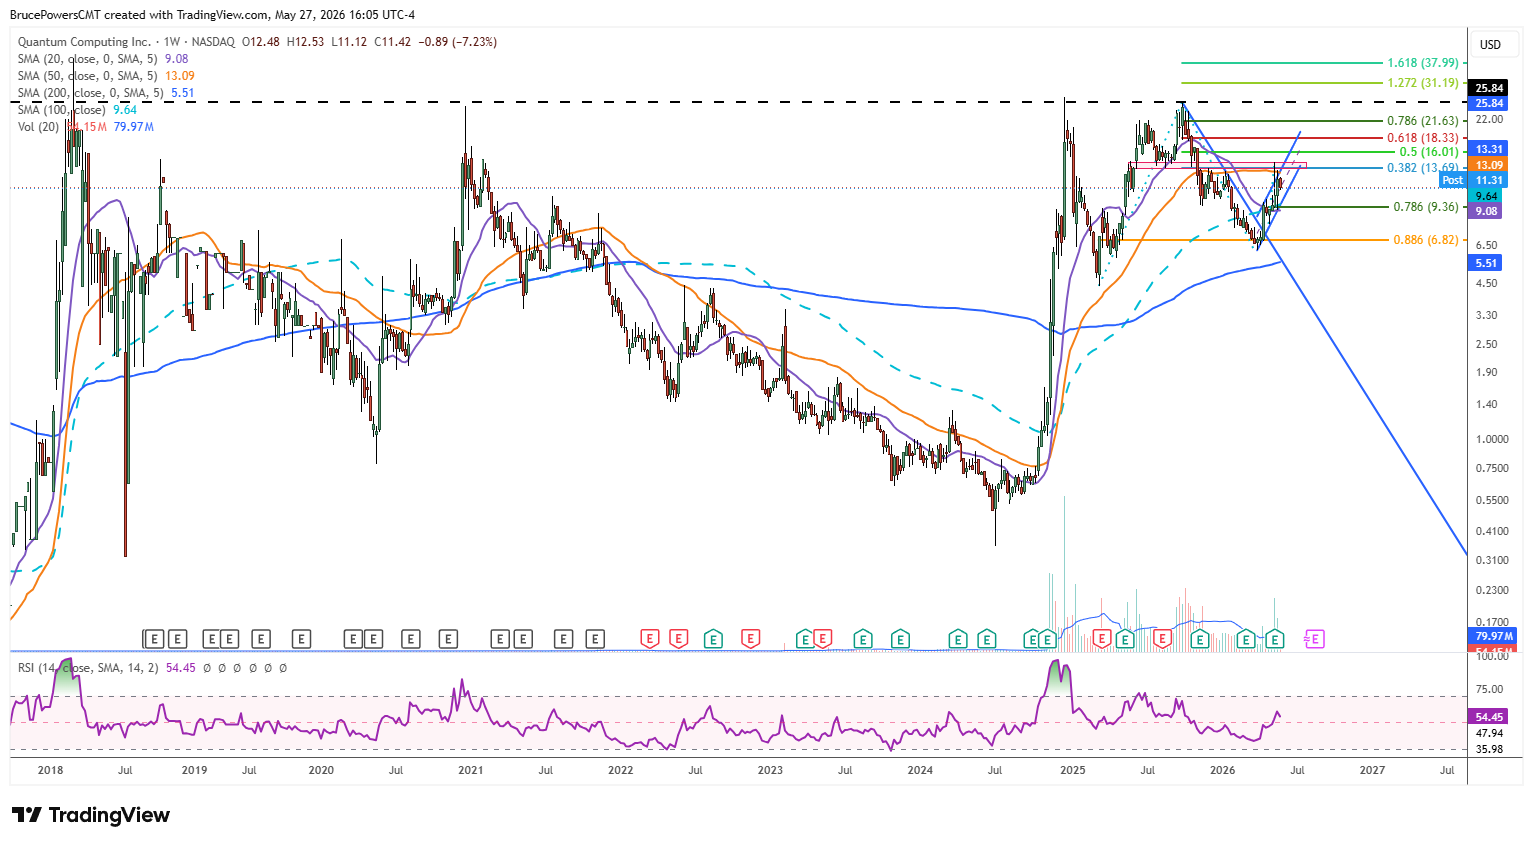
Included within the 200-day average resistance zone is a three-month price range that established a lower swing high of $13.64 in early December. An initial attempt to challenge the resistance zone ended with a trend high of $14.45 in May, followed by a pullback to test support near the 100-day moving average and the establishment of a higher swing low at $9.14. This sequence reinforces a broader consolidation structure beneath major overhead resistance.
Lower High Signals Ongoing Resistance Pressure
This week’s high of $13.39 generated a second and lower high after finding resistance for the second time near the noted resistance zone. Price behavior suggests that a deeper pullback may follow to test lower support levels and possibly extend into a consolidation phase toward the 20-day average at $10.30 and the rising uptrend line.
Trend Channel Structure Defines Short-Term Path
There is a short-term rising trend channel on the chart, which was recognized as resistance with Monday’s lower high. Although the post-earnings trend high briefly overshot the top of the channel, the close was near resistance at the top boundary. In each case, QUBT has respected the channel, which increases the possibility that the lower boundary line of the channel will be tested as support before an attempt at new trend highs occurs. Also, notably, there had not yet been a decisive close above the 200-day moving average on a sustained basis.
Breakout Threshold Toward Major Upside Extension
A sustained recovery of the 200-day moving average and lower swing high at $13.64 would trigger a trend reversal, putting QUBT on track to eventually challenge multi-year highs near the 2025 peak of $25.84. Although QUBT has lagged some other quantum stocks, relative to the 200-day moving average, once it reclaims that indicator, bullish momentum should strengthen meaningfully, improving the probability of an extended upside move.
If you’d like to know more about technical analysis and how traders use it, please visit our educational area.