Copper is produced two ways. The traditional route crushes the ore, floats out a concentrate and ships it to a smelter, and the silver in the rock travels with the concentrate and is recovered at the refinery. The other route pours sulphuric acid over oxide ore and plates the copper directly onto sheets, and nothing else in the rock comes out with it. In the first half of this year the first route shrank and the second grew. That is the wrong direction for the world’s second-largest source of mined silver, and it strengthens the supply side of the silver case, subject to one limit.
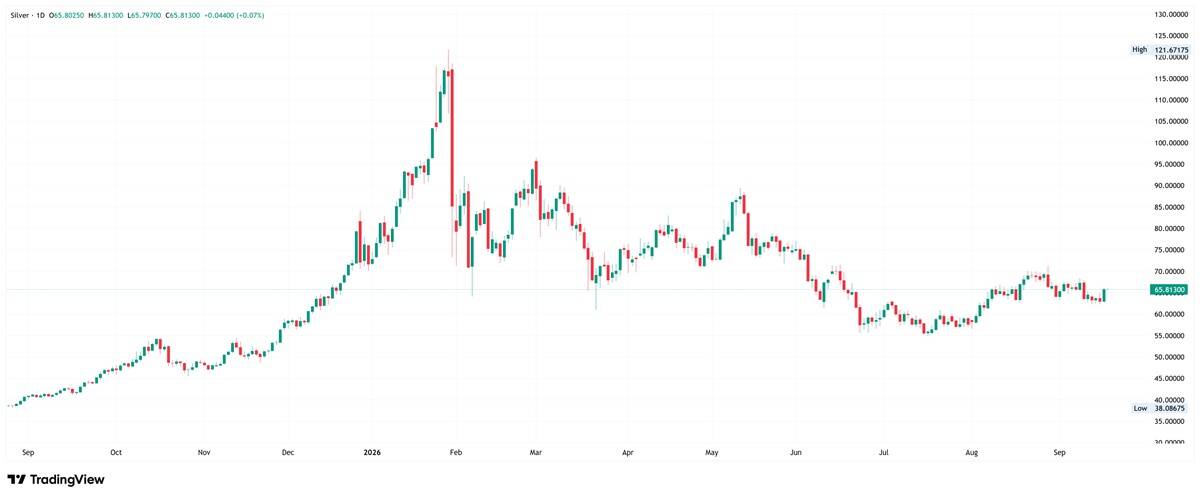
Silver traded at $62.57 an ounce late on September 16 against gold at $4,240.10, a gold-silver ratio of 67.8, after the Federal Reserve raised rates by a quarter point to 3.75% to 4.00%, its first increase since 2023, and projected another before the end of the year. Silver is about 12% below where it started 2026 and roughly 48% below its January peak of $121.58. It has fallen 5.8% since the end of August, against 4.1% for gold, in a period when a war at sea took Brent crude above $105 and Saudi Arabia shut its main export pipeline.
Each of those events would ordinarily have been read as bullish for silver. In 2026 they are read as inflation, inflation as higher rates, and higher rates as bad for a metal that pays no interest. That is the price. Supply has been moving the other way, and the Golden Meadow® research this article draws on has followed the byproduct problem for two years.
Copper Concentrate Fell 2.6%, Leached Cathode Rose 4.3%, and Only One of Them Carries Silver
The International Copper Study Group’s first-half 2026 figures, published in August and reported on September 9, show world copper mine production down 1.1% against an April forecast of 1.6% growth. The split inside that figure is what matters for silver. Concentrate output fell 2.6%. Leached cathode, the acid route, rose 4.3%. Chile fell 6.6%, Indonesian concentrate output dropped 32% with the Grasberg mine still constrained, and concentrate production in the Democratic Republic of Congo fell 34% after seismic damage at Kamoa-Kakula. Morgan Stanley now expects 2026 to be the first year of falling copper mine output since 2017.
Copper mines supplied 237.3 Moz of silver in 2025 on figures from Metals Focus and the Silver Institute, 28.0% of all mined silver and the second-largest source after lead and zinc mines. If byproduct silver moved one for one with concentrate tonnage, a 2.6% decline on that base would be roughly 6.2 Moz over a full year, or about 3.1 Moz for the half already recorded. Set beside the 6.5 to 7.5 Moz that the lead and zinc declines implied in the previous issue, the two largest sources of byproduct silver together give a sensitivity near 13 Moz, against a forecast 2026 shortfall of 46.3 Moz. Every figure in that sentence is an inference. The study groups measure copper, lead and zinc; the measured silver figure arrives in next year’s survey.
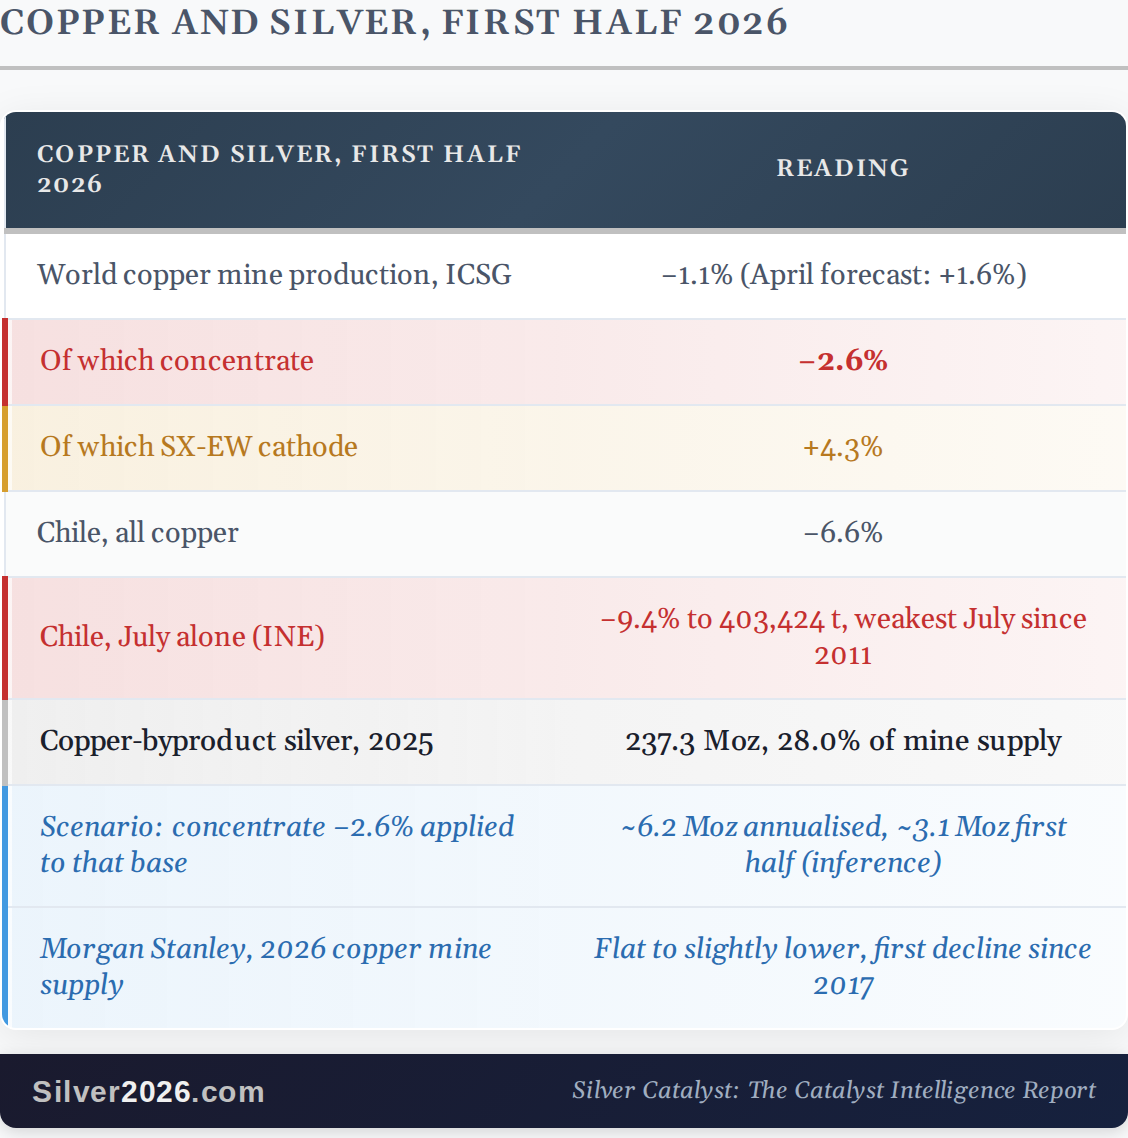
The July Chile number is a weather event as much as a grade event. Severe northern storms and maintenance cut national output to 403,424 tonnes from 445,322 a year earlier, the weakest July since 2011. Escondida, the world’s largest copper mine, was down 22.1% and Codelco down 5%, while Collahuasi rose 12.3%. Chile produced 42.7 Moz of silver in 2025, much of it as copper byproduct, so if every ounce tracked copper, one month down 9.4% would scale to about 0.33 Moz and Cochilco’s full-year expectation of a decline near 2.5% to about 1.1 Moz. Both are upper bounds, since part of Chile’s silver comes from gold mines such as Salares Norte.
A storm reverses. The process split will not reverse with the weather, though individual mines are moving in both directions. With copper near $14,000 a tonne, Collahuasi is weighing a restart of an idled acid-leaching plant, with broker SP Angel putting the target near 6,000 tonnes of cathode next year, even with Gulf sulphuric acid up from $155 to $400 a tonne since the war began.
Capstone’s Mantoverde mine runs the other way. Its own second-quarter report describes a deliberate cut to heap leaching because high-carbonate oxide ore is uneconomic at current acid prices, with roughly 5,000 tonnes less cathode expected in 2026 and the mine plan shifted toward sulphide concentrate, the process that carries silver. In aggregate the study group’s figures still show leached cathode growing while concentrate shrinks. At individual operations the acid price is now deciding which process runs, and different mines are deciding differently.
Silver Price Forecast
Every new Silver analysis as it publishes, today's technical signal and key levels, live price — on one page.
See all Silver forecastsWhat This Means to Silver Investors
On a twelve-month view, this is positive for silver, though inferred rather than measured. The argument in Silver Rising is that most silver is mined by accident, as a byproduct of lead, zinc and copper, so a higher silver price cannot call forth more silver because the people digging it up are pursuing something else. The first-half copper data adds a second clause: a higher copper price can call forth more copper without calling forth any silver either, when the marginal tonne comes from leaching rather than flotation, which is what the aggregate shows. A higher price for either metal now produces little or no extra silver.
The limit: every ounce figure here is estimated from copper, lead and zinc tonnage rather than counted. Roughly 13 Moz combined is about 1.5% of forecast mine supply of 844.1 Moz, and a market that fell 5.8% in the first half of September is not pricing any of it.
Two study groups now show first-half declines in the ore types that carry roughly 57% of mined silver, and the aggregate supply response the copper price drew came through leaching, which yields no silver. Those are the facts. The ounces attached to them are estimates until Metals Focus and the Silver Institute print the 2026 byproduct figure next spring.
Two things would change the reading. If the copper study group’s October forecast puts this year’s mine growth above 1%, or if next year’s survey shows silver from copper mines flat or higher for 2026, the scaling above was too crude and I will say so. In the meantime the longer-term case for silver rests on a shortfall that Metals Focus and the Silver Institute forecast at 46.3 Moz for 2026, running into a sixth consecutive year, and the past two weeks added evidence on the supply side of that shortfall while the price fell.
The copper split is one dimension of the 100-catalyst framework I analyze in Silver Rising, alongside the five other Deep Dives in this issue of the Silver Catalyst newsletter. If you’ve at least considered investing in silver, I strongly encourage you to sign up, because it takes just $1 to get both. Get full Silver Catalyst Newsletter and Silver Rising book for $1 today.
Thank you.
The Silver Engineer